
Figure 6.
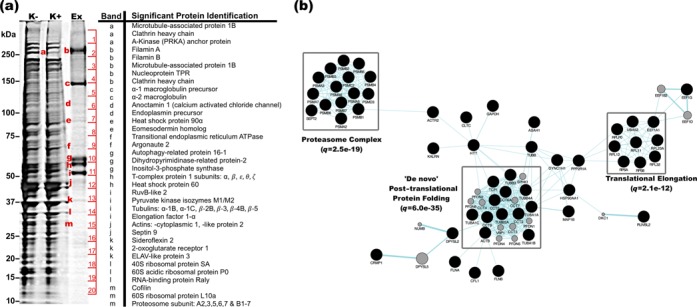
Proteomic analysis of exosomes. (a) Protein from resting cells (K−), depolarized cells (K+) and exosomes was solubilized and resolved by SDS-PAGE. Bands of interest (enumerated) were excised and sequenced by mass spectrometry. (b) Pathways analysis of 387 proteins identified by mass spectrometry. Analysis was performed using the Genemania plugin for Cytoscape software. Clusters representing the most significantly enriched functions are indicated by grey boxes, and indicative q-values shown.