
Figure 2.
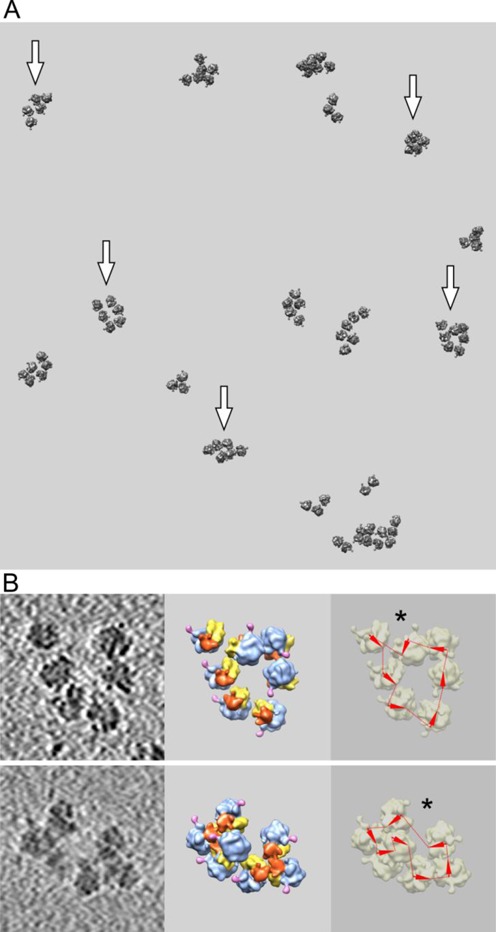
Cryo-ET analysis of polyribosomes formed in the wheat germ cell-free system with capped polyadenylated mRNA (Cap-5′UTRβGlobin-scGFP-3′UTR(N)40-(A)100) after 15 min of translation. (A) Fragment of reconstructed tomogram. Polyribosome models were obtained by fitting the averaged ribosome model as described in text and the Materials and Methods section (monoribosomes are not shown). Arrows point to polyribosomes with confirmed circular mRNA configuration, either ring-shape or double-row polyribosomes. (B) Left: tomographic slices of individual polyribosomes; middle: 3D subtomogram reconstructions of the same polyribosomes. Color indications are the same as in Figure 1. Right: deduced mRNA path within polyribosomes. Orientation of the mRNA chain in each ribosome is symbolized by an arrowhead directed from the mRNA entry to mRNA exit sites of the ribosome. The deduced path of the mRNA chain through the ribosome is shown by a line. The asterisk points to putative 3′-5′ junction.