
Figure 2.
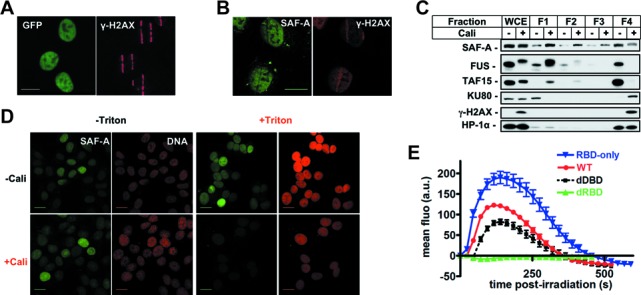
Analysis of SAF-A exclusion from chromatin following DNA damage. (A) Colocalization of SAF-A-GFP exclusion areas and γH2AX at stripes of laser damage 10 min after micro-irradiation in HT1080 cells. Scale bar, 20 μm. (B) Analysis by immunofluorescence of endogenous SAF-A and γH2AX 10 min after laser micro-irradiation in HT1080 cells. Scale bar, 20 μm. (C) HT1080 cells were mock-treated or treated with Cali for 1 h, fractionated as described in the Materials and Methods section, leading to fractions 1–4 (F1–F4) corresponding to proteins of decreasing solubility. Protein samples were denatured and separated on SDS-PAGE gel, followed by electrotransfer and blotting as indicated. (D) HT1080 cells grown on glass slides were mock-treated or treated with 10-nM Cali for 1 h at 37°C in medium. Cells were pre-extracted or not with Triton X-100 prior to fixation. Then cells were immunostained with anti-SAF-A primary and appropriate secondary antibodies and the DNA stained with propidium iodide. Scale bar, 20 μm. (E) Dynamics of various forms of SAF-A-GFP at laser-damaged sites. Images were obtained at 22-s intervals, and fluorescence intensities at the damage sites were quantified. Mean values of the fluorescence intensities with SEM were calculated from 26, 24, 29 and 16 independent measurements for RBD, WT, dDBD and dRBD forms, respectively. WT: wild-type SAF-A; RBD-only: SAF-A RNA-binding domain; dDBD: DNA-binding domain deletion; dRBD: RNA-binding domain deletion.