
Figure 3.
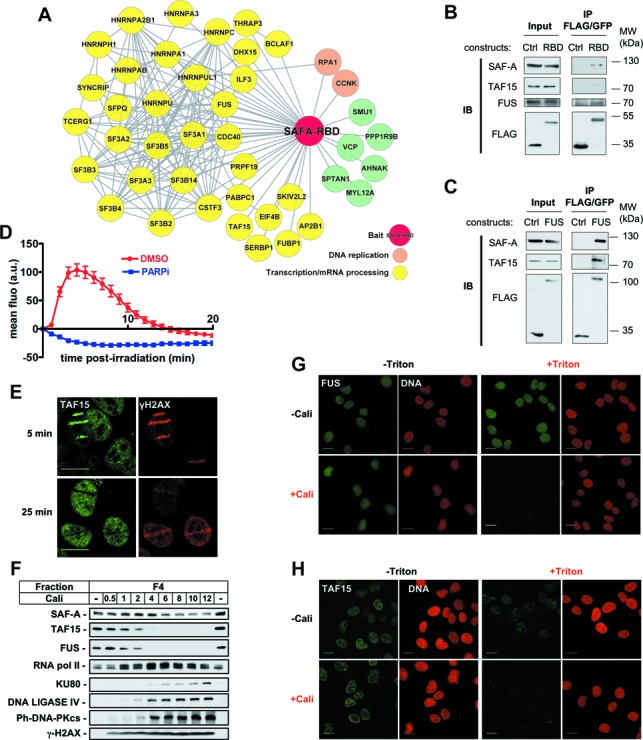
Identification of SAF-A RBD partners and analysis of their dynamics in response to DNA damage. (A) Interaction landscape representing proteins reproducibly co-immunoprecipitated with the RBD domain of SAF-A. (B,C) Co-immunoprecipitation analysis in extracts from HT1080 cells stably expressing FLAG-GFP, SAF-A-RBD-FLAG-GFP or FUS-FLAG-GFP. Immunoprecipitates were loaded on SDS-PAGE gel, followed by electrotransfer and blotting as indicated. (D) Effect of PARPi (DPQ) on the dynamics of FUS-GFP at laser-damaged sites. Images were obtained at 60-s intervals, and fluorescence intensities at the damage sites were quantified. Mean values of the fluorescence intensities with SEM were calculated from 30 and 20 independent measurements for conditions without and with PARPi, respectively. (E) Analysis by immunofluorescence of endogenous TAF15 and γH2AX 5 and 25 min after laser micro-irradiation in HT1080 cells. (F) HT1080 cells were mock-treated or treated with increase doses of Cali for 1 h, fractionated as described in the Materials and Methods section, leading to fractions 1–4 (F1–F4). Protein samples from fraction F4 were denatured and separated on SDS-PAGE gel, followed by electrotransfer and blotting as indicated. (G,H) HT1080 cells grown on glass slides were mock-treated or treated with 10-nM Cali for 1 h at 37°C in medium. Cells were pre-extracted or not with Triton X-100 prior to fixation. Then cells were immunostained with anti-FUS (G) or anti-TAF15 (H) primary and appropriate secondary antibodies and the DNA stained with propidium iodide. Scale bar, 20 μm.