
Figure 4.
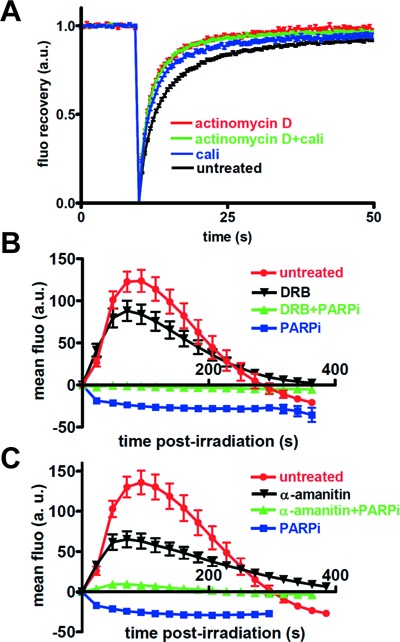
Effect of transcription inhibition on SAF-A mobility and dynamics in response to DNA damage. (A) Effect of DNA damage by calichemicin γ1 (Cali) and/or transcription inhibition (actinomycin D) on FRAP curve for SAFA-GFP. Images were obtained at 487-ms intervals. The data were normalized to the prebleach fluorescence level. The graph shows FRAP curves of mean values with SEM of 52, 52, 28 and 52 independent fluorescence measurements for conditions with actinomycin D, actinomycin D + Cali, Cali and no agent, respectively. (B) Effect of a PARPi (DPQ) and a transcription inhibitor (DRB) on the dynamics of SAF-A-GFP at laser-damaged sites. Images were obtained at 22-s intervals, and fluorescence intensities at the damage sites were quantified. Mean values of the fluorescence intensities with SEM were calculated from 12, 14, 17 and 17 independent measurements for conditions without inhibitor and with DRB, DRB+PARPi and PARPi, respectively. (C) Effect of a PARPi (DPQ) and a transcription inhibitor (α-amanitin) on the dynamics of SAF-A-GFP at laser-damaged sites. Images were obtained at 22-s intervals, and fluorescence intensities at the damage sites were quantified. Mean values of the fluorescence intensities with SEM were calculated from 12, 17, 17 and 25 independent measurements for conditions without inhibitor and with α-amanitin, α-amanitin+PARPi and PARPi, respectively.