
Figure 3.
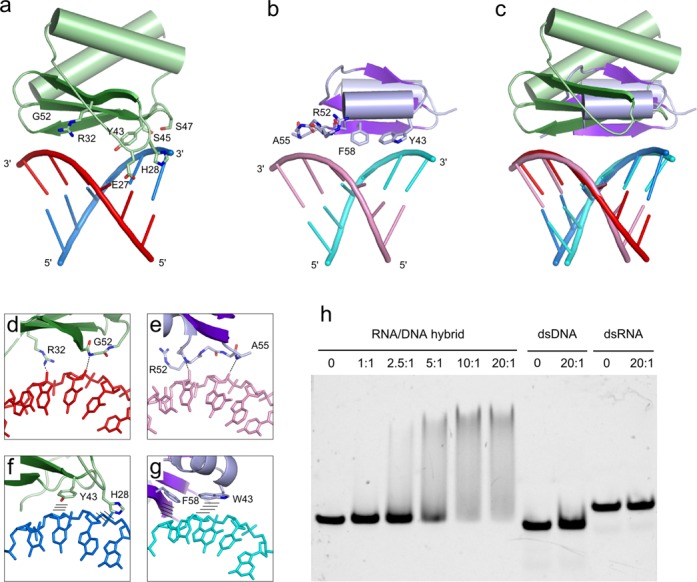
Substrate binding by the N-domain. (a) N-domain of RNase H3 bound to an RNA/DNA hybrid. DNA is shown in blue, and RNA is shown in red. Residues that interact with the nucleic acid are shown as sticks and labeled. (b) HBD of human RNase H1 domain (PDB ID: 3BSU (11)) bound to an RNA/DNA hybrid. DNA is shown in cyan, and RNA is shown in pink. Residues that interact with the nucleic acid are shown as sticks and labeled. (c) Superimposition of N-domain of RNase H3 and HBD of RNase H1 protein–substrate complexes. (d) and (e) Close-up view of selected interactions that provide recognition of the RNA strand by (d) N-domain and (e) HBD. Interactions are indicated with the dashed lines. (f) and (g) Close-up view of selected interactions that provide recognition of the DNA strand by (f) N-domain and (g) HBD. Stacking interactions between aromatic side chains and deoxyribose rings are indicated with lines. (h) EMSA of nucleic acid binding to the isolated N-domain of Ta-RNase H3. The samples contained equal amounts of fluorescently labeled 24-bp substrates. The protein:substrate molar ratio in the sample is indicated. Control lanes with no protein added are indicated by 0. The samples were resolved on a 10% native TAE polyacrylamide gel.