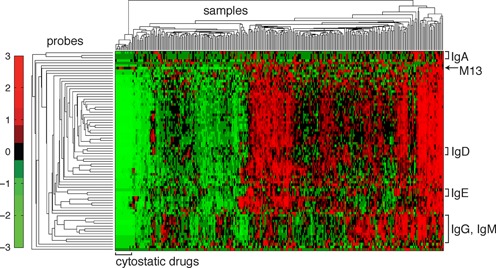
Figure 6.

Unsupervised hierarchical clustering of the standardized RASL-seq data matrix from one 384-well plate of a human B cell antibody isotype switching small molecule screen. The columns of the matrix correspond to samples, and the rows to individual RASL-seq probe sets. The values of the clustered, standardized data matrix are represented by colors that correspond to the legend on the left side of the clustergram. All isotype probes were observed to cluster with other probes targeting the same isotype (identified by brackets on the right of the clustergram). Samples with low overall counts were enriched for cytostatic drugs that reduce cell proliferation, and thus sample transcript abundance (clustered toward the left side of the clustergram).
