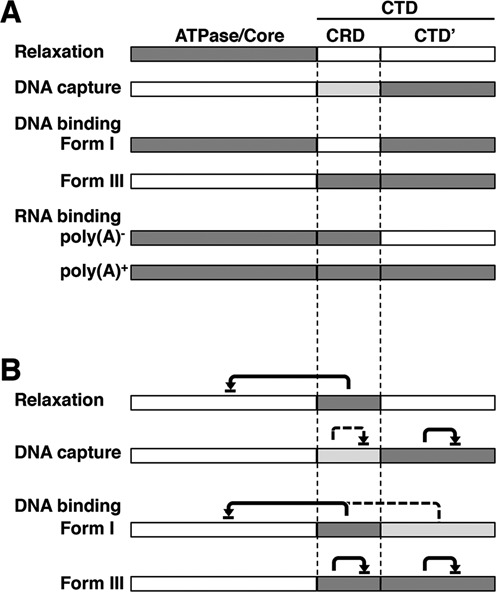
Figure 8.

Summary for relative contributions of topo IIβ functional domains. (A) Domains involved in the activities shown on the left are shaded. Dark shade and light shade represent full and partial contribution, respectively. (B) RNA-mediated inhibition. Inhibitory domains are shaded depending on their relative contributions as in (A). Domains pointed by arrowhead are inhibited domains. Solid line and broken line designate the strong and weak inhibitions, respectively. Form I, supercoiled DNA; Form III, linear DNA.
