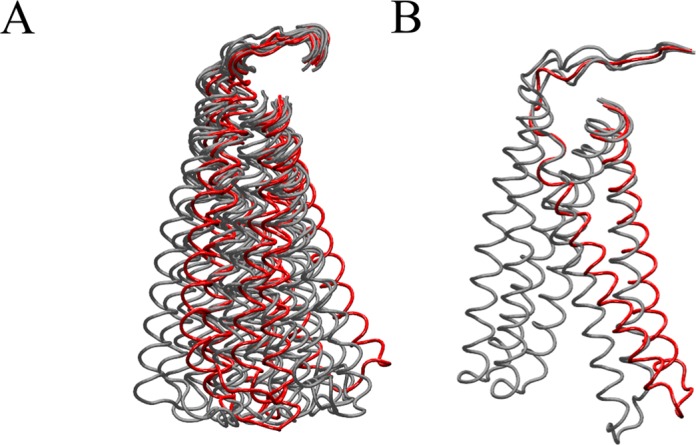
Figure 3.

Clustering of the structures of the linker domain, comprising residues Ala625-Lys712, in the simulation of hTop1Blin (A) and hTop1Bsc complexes (B). The centroids of the four families representing 96% of total structures in hTop1Blinear and of the only one representing 98% of total structures in hTop1Bsc are reported in red.
