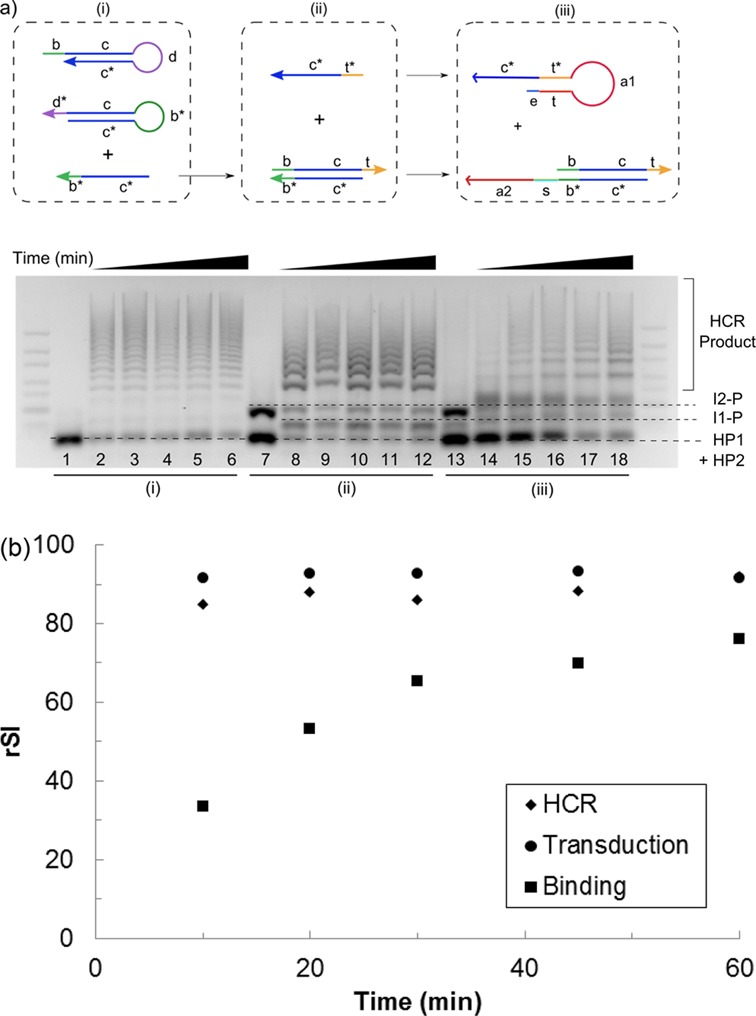
Figure 4.

(a) (Top) Kinetics of the individual module was characterized by decomposing each module into the basic DNA components required for the process: (i) a trigger strand (c* b*) to initiate the HCR, (ii) addition of a protector (b c t) and initiator strand (t* c*) to control signal transduction and (iii) the incorporation of the aptamer sequences (a1 and a2) into the two respective initiator strands to achieve α-thrombin binding-induced signal development. (Bottom) Gel electrophoresis image of the kinetics of the three individual modules as labeled below the gel. The reaction was allowed to proceed for various time periods of 10, 20, 30, 45 and 60 min (from left to right of each module) at 37°C. Lanes 1, 7 and 13 correspond to the negative control for each module where the trigger was not added, i.e. c* b* strand for HCR, t* c* strand for signal transduction and α-thrombin for target binding. The identity of each band was indicated with dotted lines. (b) α-thrombin binding, and hence the molecular switch opening step, was found to be still rate limiting although the time required to reach equilibrium was shortened to ca. 30 min at 37°C. rSI, relative signal intensity.
