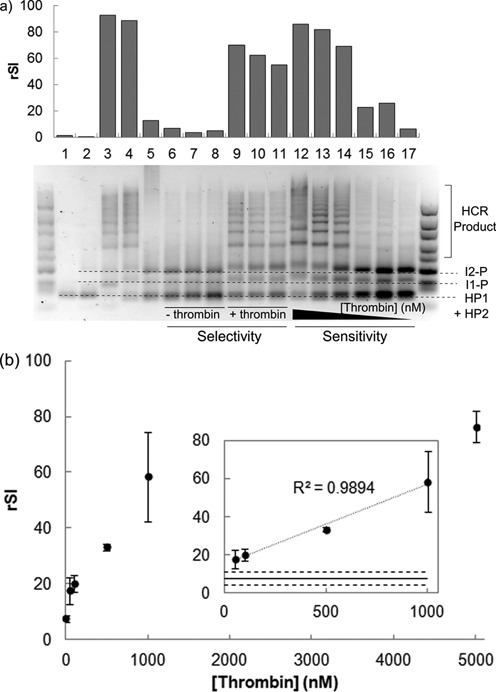
Figure 5.

(a) Gel electrophoresis image of the performance of proximity-based sensing circuit evaluated at 37°C. Lanes 6–11 represents the assay selectivity in presence of interference from 1 μM BSA (lanes 6 and 9), 1% FBS (lanes 7 and 10) and 10% FBS (lanes 8 and 11). HCR was not triggered by non-specific protein and interfering matrix (lanes 6–8) and the signal in presence of α-thrombin could develop even with interferences (lanes 9–11). Lanes 12–17 represent the signal developed in presence of 5 μM, 1 μM, 0.5 μM, 0.1 μM, 50 nM and 0 nM of α-thrombin. Lane 1 corresponds to hairpins (HP1 and HP2) only; lane 2 corresponds to hairpins and initiator 2–protector (I2-P) complex; lane 3 corresponds to hairpins, I2-P and t* c* trigger strand; lanes 4 and 5 represent equilibrium signal in presence and absence of 1 μM α-thrombin. A 10–300 bp DNA ladder is shown at both sides of the gel. The relative signal intensity (rSI) of the HCR products formed is indicated above the respective lanes. The identity of each band was indicated with dotted lines. (b) The HCR signal developed exhibited dosage-dependence for a physiologically relevant α-thrombin concentration ranging from 50 nM to 5 μM. Inset: A linear dosage-signal relationship (R2 = 0.99) was obtained for α-thrombin concentration of 50 nM to 1 μM. The solid line represents the mean background noise in absence of α-thrombin while the dashed lines represent ±3 σ of this mean. The upper bound represents the limit of detection of the assay which was found to be 50 nM in this study. All data are shown as mean ± standard deviation (n = 3).
