
Figure 2.
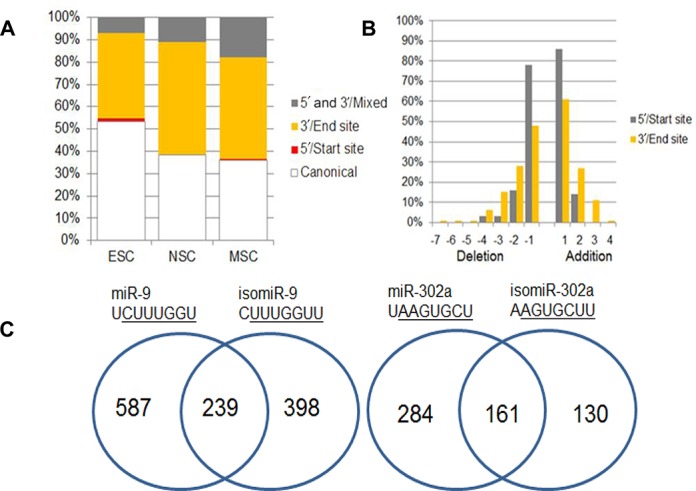
The distribution of 5′ and 3′ isomiRs in hESCs, NSCs and MSCs. (A) A bar graph illustrating the percentage of isomiRs with 5′or 3′ changes compared to the dominant miRNA for ESC, NSC and MSC miRNA libraries. (B) Additions and deletions at the 5′ and 3′ ends for ESC, NSC and MSC miRNAs combined and expressed as a percentage. (C) Venn diagrams comparing the predicted targets of mir-9–1 and the most common 5′ isomiR-9 and similarly for miR-302a. Predictions were made by TargetScanHuman (canonical) and TargetScan custom (isomiRs).