
Figure 4.
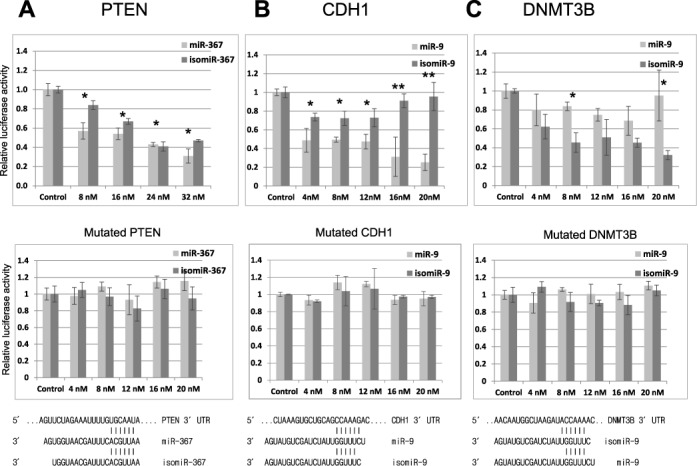
5′ and 3′ isomiR analysis in luciferase assays. (A) Top panel: the 3′UTR of PTEN was cloned into the luciferase vector pGL3 (Promega) and its relative luciferase acitivity is plotted following its transfection (400 ng) into HEK293 cells with the indicated concentrations of miR-367 and a 3′ isomiR. Middle panel: repeat luciferase assay following mutation of the predicted seed target site for miR-367 within the 3′UTR of PTEN. Bottom panel: illustration of the sequences and expected alignment of miR-367 and isomiR-367 against the 3′UTR of PTEN. (B and C) Top panel: identical analyses of cloned regions of the 3′UTR of CDH1, which has a predicted target site for miR-9 and for DNMTB3, which has a predicted target site for a 5′isomiR of miR-9. Middle panels: repeat luciferase assays following mutation of the predicted seed target sites within the 3′UTRs. Bottom panel: illustration of the sequences and expected alignments of miR-9 and 5′isomiR-9 against the 3′UTRs of CDH1 and DNMT3B. The 3′UTRs regions that were chosen and the seed target site mutations are described in Supplementary Table S4. Error bars represent the standard deviation obtained from three independent experiments, * and ** represent statistical significance at the levels of P < 0.05 and P < 0.0001, respectively. Renilla luciferase was used as internal control to standardize against all firefly luciferase activities. n = 3. Note for top panels B and C the statistical difference is between single columns for miR-9 and isomiR-9, whereas for A the statistical difference is between the treatments and the control column pairs.