
FIGURE 1.
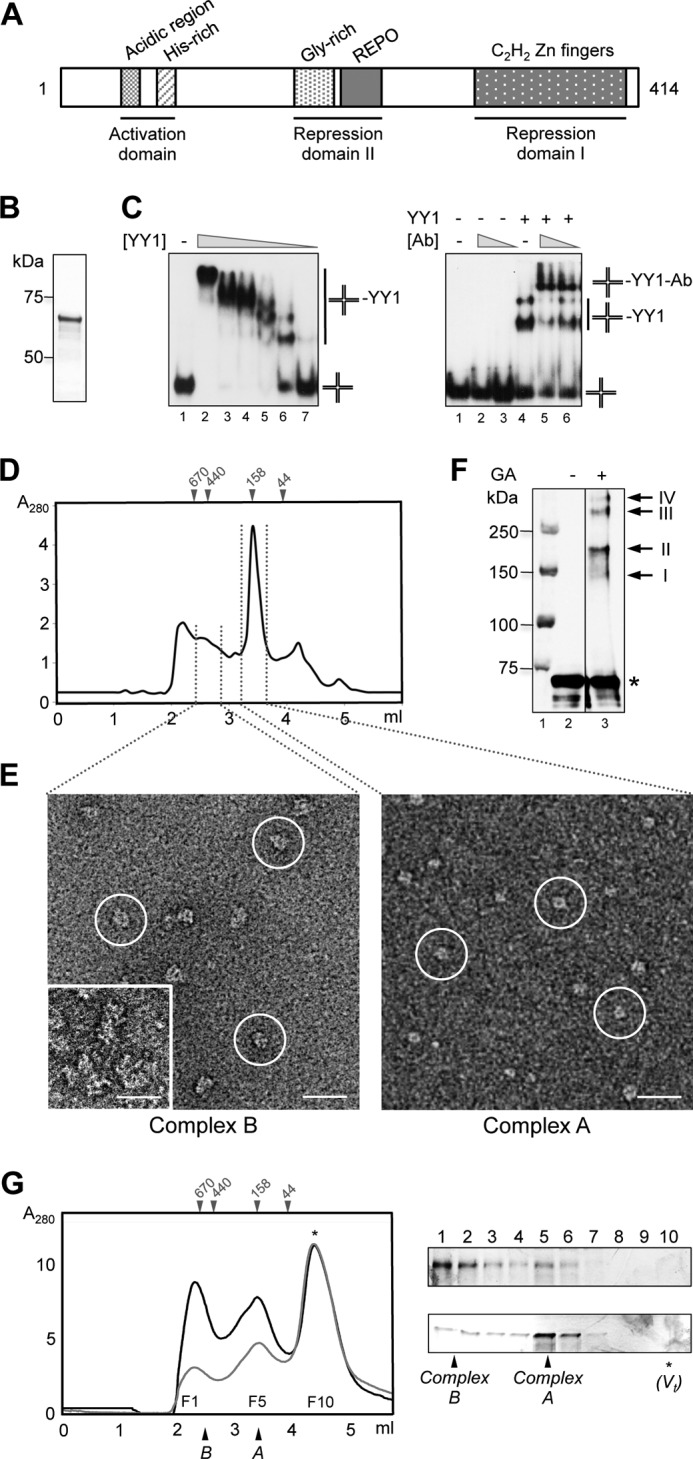
Purification and characterization of human YY1. A, scheme of human YY1 primary sequence. Relevant domains and motifs are indicated. B, SimplyBlue (Invitrogen) staining SDS-PAGE of purified His-YY1. C, left panel, His-YY1 was incubated with a synthetic HJ DNA (described as J3 under “Experimental Procedures”), and reactions were resolved by 6% non-denaturating PAGE. 0.3 nm of HJ (J3) (lane 1) was titrated with increasing amounts of YY1 (lanes 2–7, 1920, 960, 480, 240, 120, and 60 nm, respectively). Right panel, antibody super shift experiments demonstrated the specificity of the interaction. Lane 1, HJ probe alone (described as HJ_25_no_sp under “Experimental Procedures”); lanes 2 and 3, 2 and 1 μg of anti-YY1 antibody (Ab) alone, respectively; lane 4, YY1 protein alone (100 nm); lanes 5 and 6, incubation of YY1 protein (100 nm) with 2 and 1 μg of anti-YY1 antibody, respectively. Positions of unbound HJ probe, YY1-HJ, and YY1-HJ-antibody shifted-bands are indicated. D, SEC of purified His-YY1 in a BioSep-SEC-S4000 (Phenomenex) column. The column was calibrated with molecular weight standards (GE Healthcare), and the elution volume for some of the standards is shown on the top of the chromatogram. E, different fractions from the SEC in D were observed in the electron microscope, and fields from representative electron micrographs are shown. Typical molecule images are highlighted within circles. The inset in the left panel shows a view of aggregates found to elute first from the SEC column. The scale bar represents 250 Å. F, Western blot with an anti-YY1 antibody of His-YY1 after cross-linking with glutaraldehyde (GA); lane 1, molecular weight standards (Bio-Rad); lane 2, control without GA; lane 3, 30 min of incubation with GA. His-YY1 monomer migrates as a 70-kDa protein in SDS-PAGE (labeled as *). Cross-linked bands, with a relative molecular weight multiples of the YY1 monomer, are labeled with arrows. G, SEC of His-YY1 was as in D (black line). The peak fraction corresponding to complex B was re-injected (gray line) in the same column, and the fractions (F1 to F10) of both experiments were analyzed by silver-stained SDS-PAGE. The top panel corresponds to fractions from the black line and bottom panel for the gray line chromatography, respectively. Positions of the YY1 complexes A and B as well as molecular weight standards (GE Healthcare) used for column calibration are indicated. Total volume of the column (Vt) is indicated by an asterisk (*).