FIGURE 5.
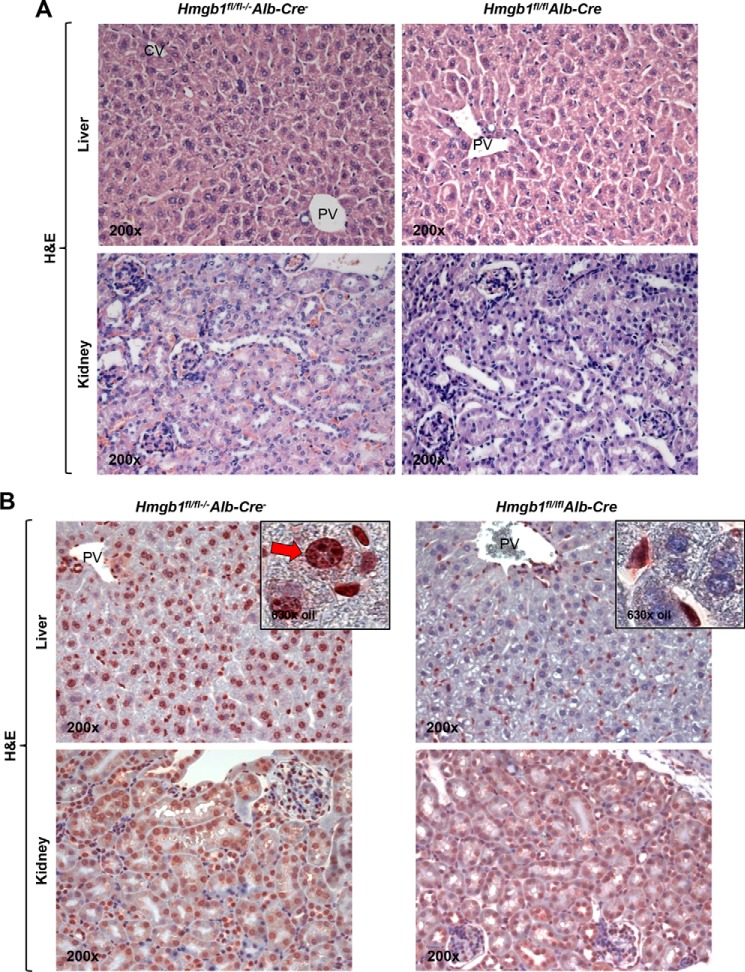
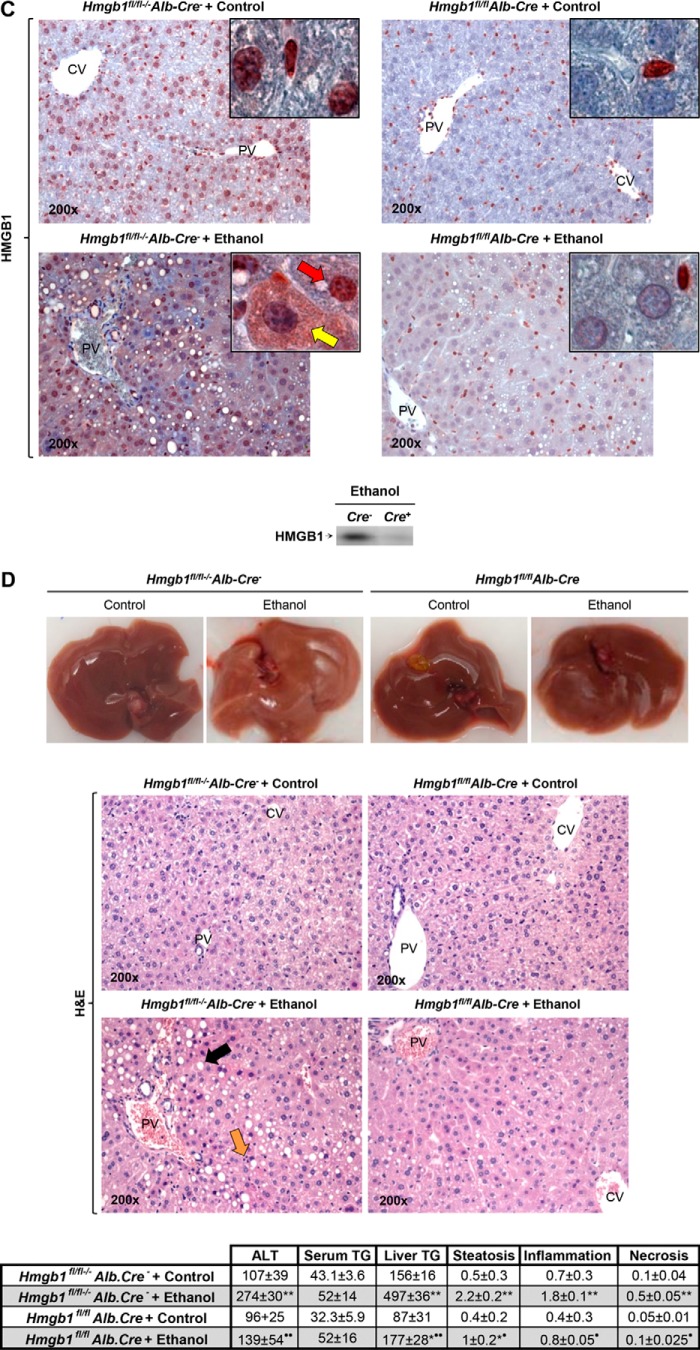
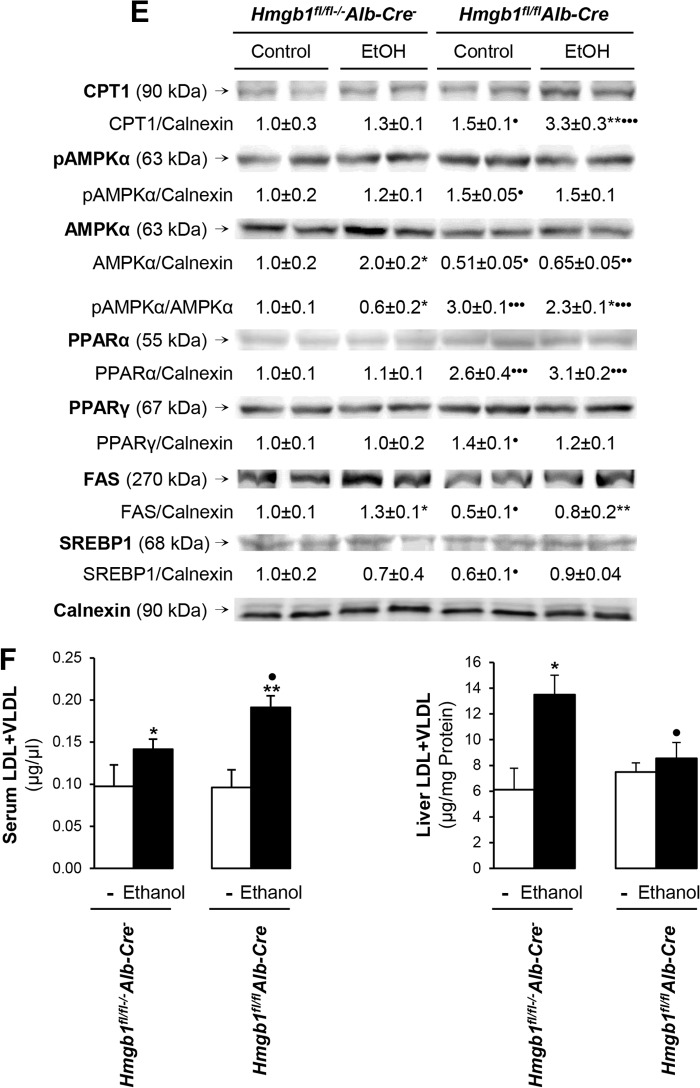
Hmgb1fl/flAlb-Cre mice are protected from ALD. H&E staining from liver and kidney from non-treated Hmgb1fl/flAlb-Cre and Hmgb1fl/fl−/−Alb-Cre− littermates is shown (A). HMGB1 IHC from liver and kidney from non-treated Hmgb1fl/flAlb-Cre mice and Hmgb1fl/fl−/−Alb-Cre− mice is shown (B). The livers from Hmgb1fl/flAlb-Cre mice confirmed the absence of HMGB1-positive staining in hepatocytes compared with Hmgb1fl/fl−/−Alb-Cre− mice (red arrow). Hmgb1fl/flAlb-Cre and Hmgb1fl/fl−/−Alb-Cre− littermates were fed for 7 weeks the control or the ethanol Lieber-DeCarli diet. In IHC for HMGB1, the red arrow indicates HMGB1 positive staining in the nucleus and negative staining in the cytoplasm, and the yellow arrow points to HMGB1 negative staining in the nucleus and positive staining in the cytoplasm (C, top). Western blot analysis for HMGB1 in the ethanol-fed mice only is shown (C, bottom). Images show the gross appearance of the livers from control and ethanol-fed Hmgb1fl/flAlb-Cre and Hmgb1fl/fl−/−Alb-Cre− mice (D, top). H&E staining shows steatosis (black arrow) and inflammation (orange arrow) (D, middle). Serum alanine aminotransferase (ALT) activity (units/liter), serum triglycerides (TG) (mg/dl), and liver triglycerides (mg/g of protein) along with the scores for steatosis, inflammation, and necrosis classified according to the Brunt scoring system (40) are shown (D, bottom). n = 10/group. *, p < 0.05; **p < 0.01 for ethanol versus control. •, p < 0.05; ••, p < 0.01 for Hmgb1fl/flAlb-Cre versus Hmgb1fl/fl−/−Alb-Cre−. Hmgb1 ablation increases CPT1, pAMPKα, and pPPARα expression and enhances LDL plus VLDL export, preventing steatosis and liver injury in mice. Western blot analysis revealed an increase in the expression of CPT1, pAMPKα, and pPPARα in ethanol-fed Hmgb1fl/flAlb-Cre mice compared with Hmgb1fl/fl−/−Alb-Cre− littermates (E). Serum and liver LDL plus VLDL levels in control and ethanol-fed Hmgb1fl/flAlb-Cre and Hmgb1fl/fl−/−Alb-Cre− mice are shown (F). Results are expressed as average values ± S.E. n = 10/group. *, p < 0.05; **, p < 0.01 for ethanol versus control. •, p < 0.05; •••, p < 0.001 for Hmgb1fl/flAlb-Cre versus Hmgb1fl/fl−/−Alb-Cre−. PV, portal vein; CV, central vein.


