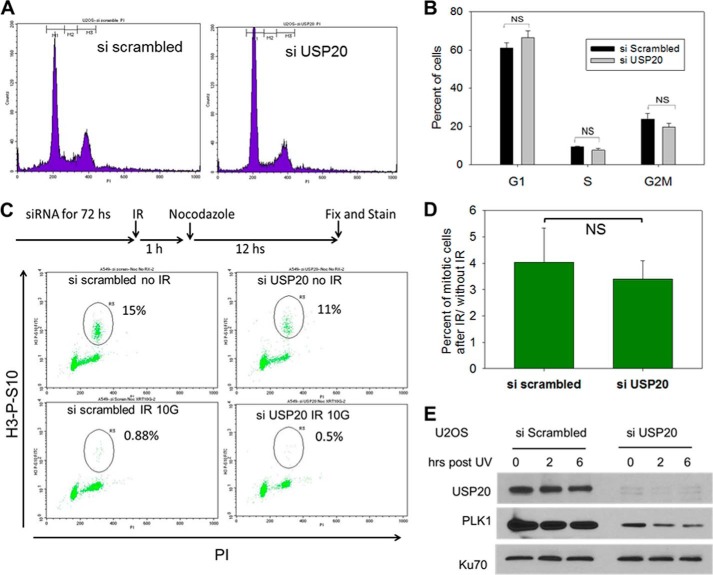
FIGURE 8.
Cell cycle distribution and G2/M checkpoint in cells depleted of USP20. A, cell cycle phase distribution in USP20 depleted cells versus control. B, percentage of cells in each cell cycle phase. C, G2/M checkpoint analysis. Cells were exposed to siRNA and then treated with 6 Gs of IR followed an hour later by 200 ng/ml of nocodazole to trap them in mitosis. Mitotic cells were identified by being positive in histone 3, serine 10 phosphorylation (y axis), against propidium iodide (PI) DNA stain (x axis). D, G2/M checkpoint is assessed by measuring the percentage of cells that entered mitosis after IR compared with those that enter mitosis during the same period and without IR exposure. E, PLK1 down-regulation following USP20 depletion. Ku70 is utilized to show equal protein loading.

