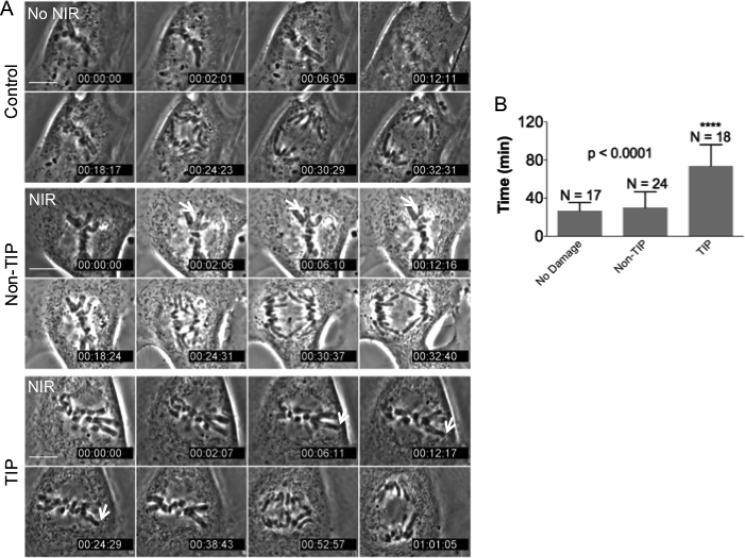
FIGURE 2.
TIP damage results in cell cycle delay. A, time lapse microscopy images (in minutes) of mitotic non-irradiated cell (control) and cells irradiated at non-TIP and TIP. The white arrow points to the irradiated chromosome. Scale bar, 10 μm. B, duration of metaphase progression to anaphase was measured in individual cells (non-irradiated or microirradiated at non-TIP or at TIP) using time lapse microscopy imaging with 120-s intervals (see “Materials and Methods” for details) (p < 0.0001 TIP compared with the control). Error bars, S.D.

