FIGURE 7.
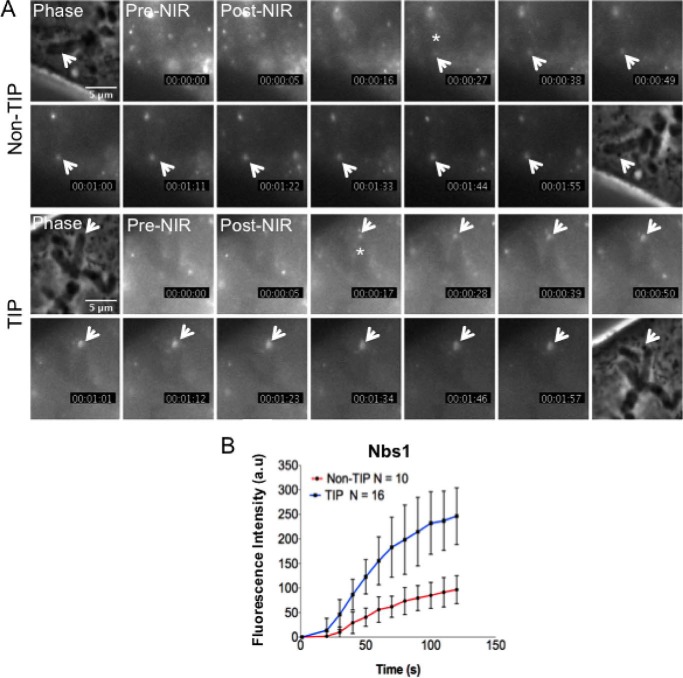
Nbs1 accumulates faster at damaged chromosome tip. A, live cell imaging of GFP-Nbs1 accumulation (asterisk shows when Nbs1 starts to accumulate, and white arrow points to the accumulation of Nbs1) at non-TIP and TIP sites of PtK2 cells after microirradiation. Pre-NIR, image taken before microirradiation at time 0 s; Post-NIR, image taken immediately after microirradiation. The white arrows indicate where damage was induced on a single chromosome (Phase image). Fluorescent Nbs1 recruitment at non-TIP and TIP sites was captured at 10-s intervals for 120 s after irradiation. The fluorescent signals were normalized by subtracting the GFP signals in the corresponding regions before damage induction (the pre-laser image (Pre-NIR)). The numbers at the bottom right of each image indicate elapsed time after damage induction (s). B, quantitative measurements (mean ± S.D. (error bars)) at 10-s intervals of GFP-Nbs1 accumulation at TIP (n = 16) and non-TIP (n = 10) sites (p = 0.0048, analysis of variance). a.u., arbitrary units.

