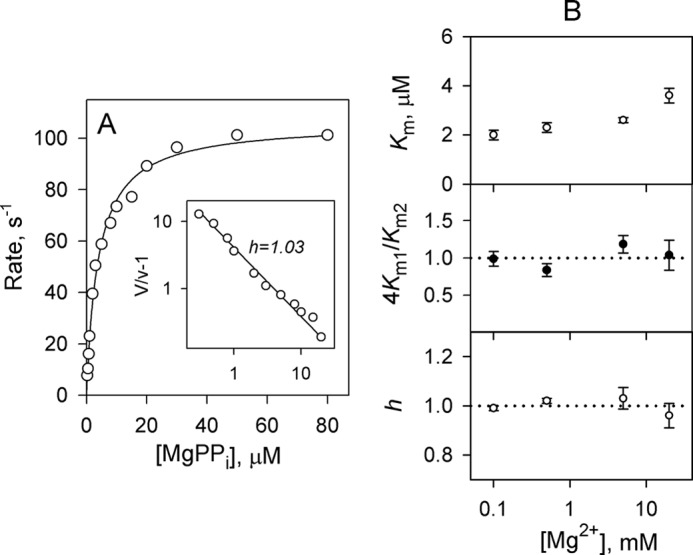
FIGURE 4.

Lack of kinetic cooperativity in dhPPaseΔCDC. Left, rate versus substrate concentration profile measured in the presence of 5 mm Mg2+. Enzyme concentration in the assay was 0.1–4 nm. The line represents the best fit for a Michaelis-Menten equation. The inset shows a Hill plot of the data; both axes are scaled logarithmically. Right, Mg2+ concentration dependence of kinetic parameters. The panels show (from top to bottom) the Michaelis constant Km1, the ratio 4Km1/Km2, and the Hill coefficient h. The horizontal dotted lines (4Km1/Km2 = 1 and h = 1) mark the boundary between positive and negative cooperativity. Error bars represent S.E.
