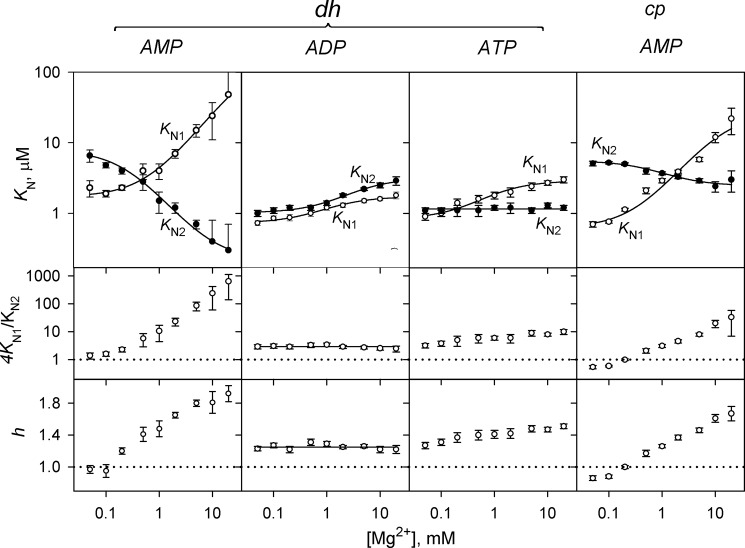
FIGURE 7.
Mg2+ concentration dependence of nucleotide binding cooperativity in dhPPase and cpPPase. The panels show (from top to bottom) KN1 (○) and KN2 (●) values, the ratio 4KN1/KN2, and the Hill coefficients. The enzyme and nucleotide identities are indicated on the top of the panels. The KN1 and KN2 lines show the best fits for Equation 6. The horizontal dotted lines (4KN1/KN2 = 1 and h = 1) mark the boundary between positive and negative cooperativity. Error bars represent S.E.

