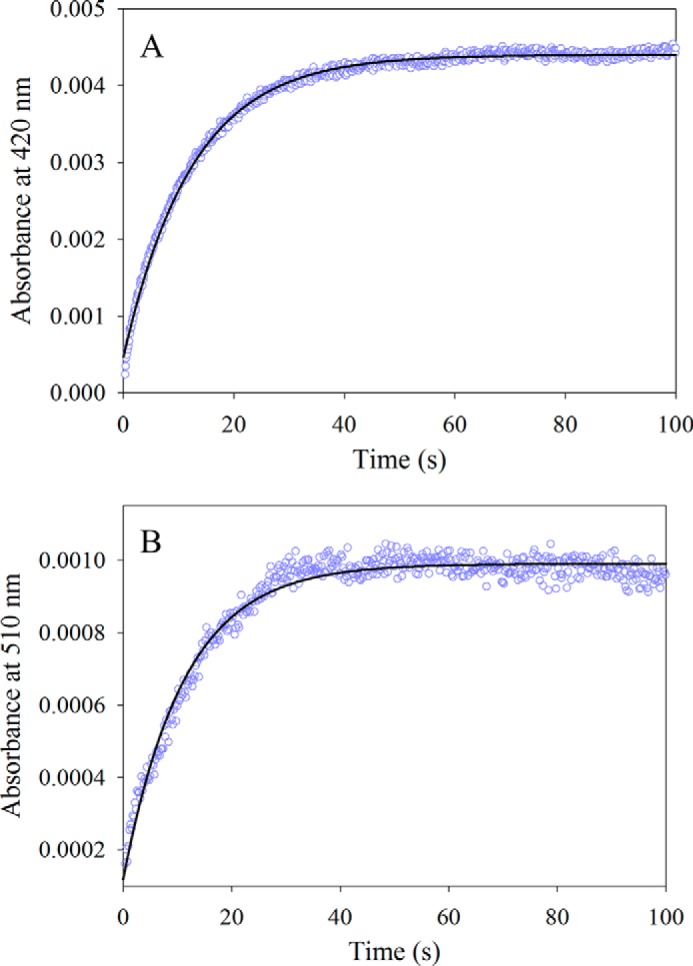
FIGURE 2.

Reaction between wild-type mALAS2 (30 μm) and glycine (100 mm). A, progress curve for the formation of the glycine external aldimine monitored at 420 nm. The data (open purple circles) were fit to a single-exponential equation with an observed rate constant (k1) of 0.080 ± 0.001 s−1 and amplitude (A1) of 4.00 × 10⁻³ ± 0.01 × 10⁻³. B, progress curve for the formation of the glycine quinonoid intermediate monitored at 510 nm. The data (open purple circles) were fit to a single-exponential equation with an observed rate constant (k1) of 0.070 ± 0.001 s−1 and amplitude (A1) of 0.80 × 10⁻³ ± 0.01 × 10⁻³.
