
FIGURE 4.
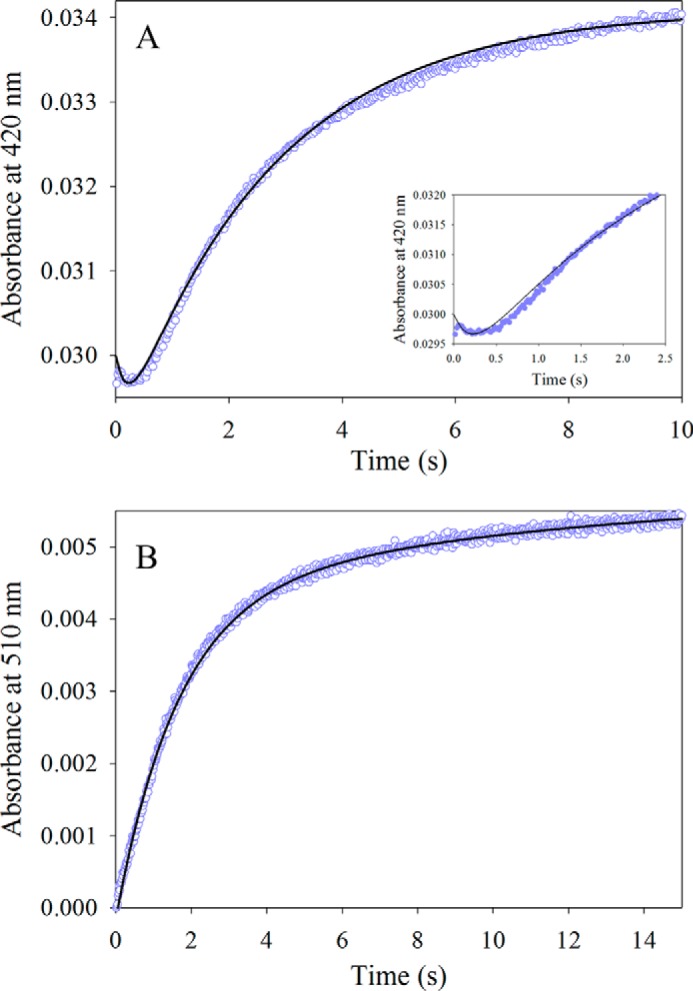
Reaction between wild-type mALAS2 (30 μm) and ALA (10 mm). A, progress curve for the formation of the ALA-mALAS2 external aldimine as monitored at 420 nm. The data points were fit to a two-exponential equation yielding the observed rate constants (k1 and k2) and amplitudes (A1 and A2): k1 = 4.7 ± 0.01 s−1 and A1 = 1.1 × 10⁻³ ± 0.07 × 10⁻³ for the fast phase, and k2 = 0.37 ± 0.003 s−1 and A2 = 5.2 × 10⁻³ ± 0.02 × 10⁻³ for the slow phase. The inset shows the first 2.5 s of the reaction. B, progress curve for the formation of the ALA quinonoid intermediate as monitored at 510 nm. The observed rate constants (k1 and k2) and amplitudes (A) were: k1 = 0.61 ± 0.01 s−1 and A1 = 4.50 × 10⁻³ ± 0.07 × 10⁻³ for the fast phase, and k2 = 0.08 ± 0.01 s−1 and A2 = 1.50 × 10⁻³ ± 0.04 × 10⁻³ for the slow phase.