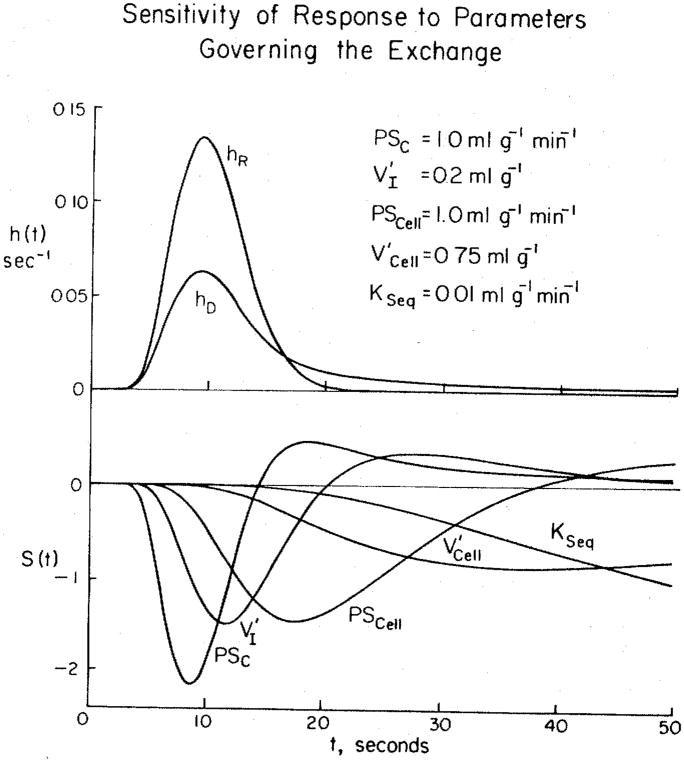
Figure 1.
Solutions and sensitivity functions for a model of blood-tissue exchange in the heart. Upper panel) Impulse responses for a system consisting of arteries and veins and a set of capillary-tissue units in parallel. The large-vessel transport functions are described by a unimodal density function with mean transit time 7.9 s, relative dispersion 0.34, and skewness 0.75 (3a). The curve for the intravascular reference hR(t) is the large-vessel transport function convoluted with the weighted sum of 2, fifth-order Poisson operators representing the intracapillary transport and dispersion. The mean capillary transit time was 3.0 s. The curve hD(t) for the permeating tracer has parameters suitable for D-glucose in the heart. The flow Fs was 1 ml · g−1 · min−1; the parameters governing the exchange and the intracellular sequestration KSeq are listed. Lower panel) Sensitivity functions for each of the governing transport parameters. Note that all are different from the others, and that they are ordered in time in accordance with the sequence of solute transport from blood into the cells. The functions S(t) are for 1 % changes in parameter values and multiplied by scalars for display purposes: the scalars are 1 for PSc, 160 for V′I, 5 for PSCell, 500 for , and 1500 for KSeq.

