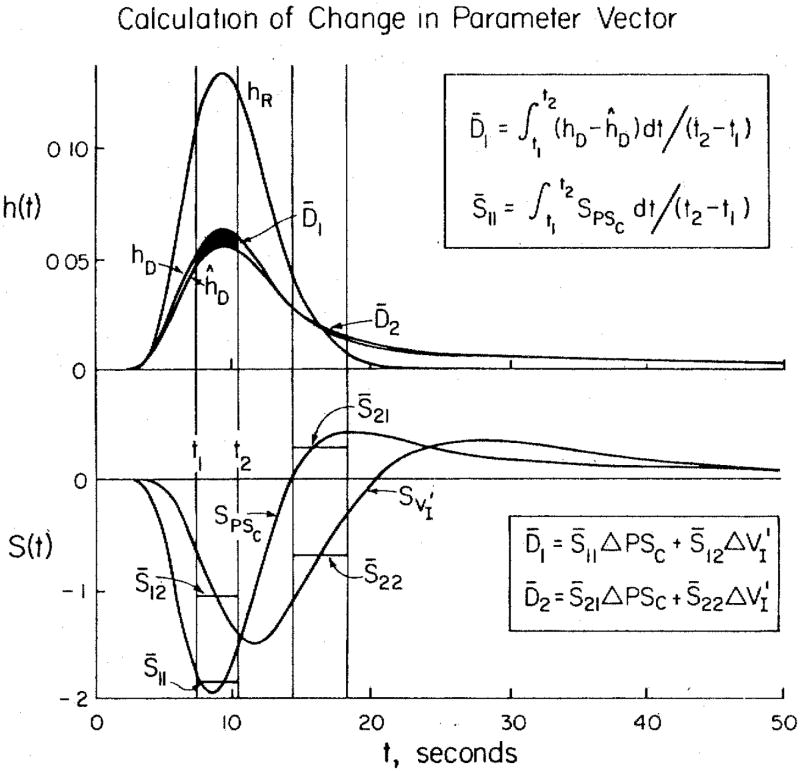
Figure 2.
Calculation of adjustment in parameter vector for fitting a model to data. There are two unknowns, PSC and V′1. The intravascular reference data curve is hR(t). The model curve ĥD(t) differs from the data curve hD(t): the differences in each of the two time windows are given by the average differences D̄1 and D̄2, the area divided by the window width. The average values of the sensitivity functions in the two time windows are given by the S̄’s. These give the coefficients defining the influences of the two parameters in each of the two regions along hD(t).

