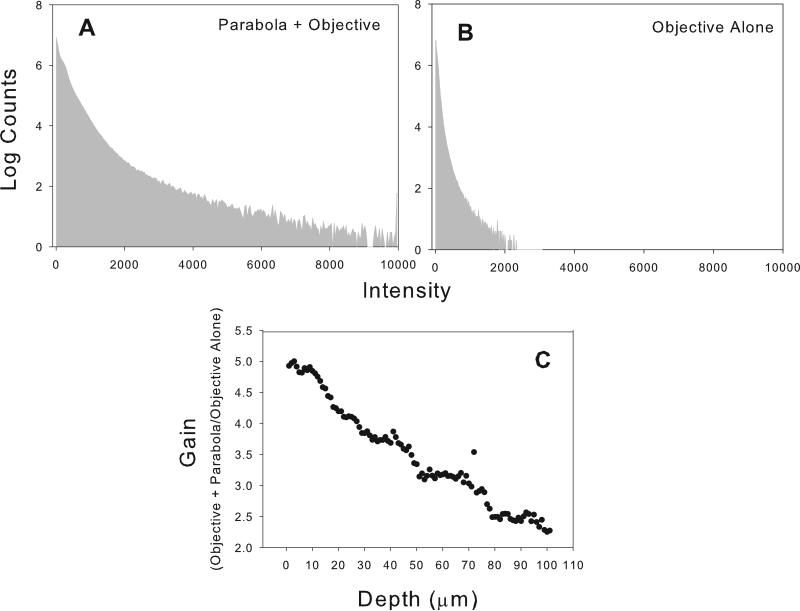
Figure 3.
Raw data of pixel intensities and gain by depth for the image stack depicted in figure 2A. A and B represent pixel histograms of intensities for the entire image stack depicted in 2A for c-TED and for the objective alone microscope configurations, respectively. C. Gain in collection efficiency as a function of imaging depth for the fat-dominated, mixed tissue depicted image shown in figure 2A.

