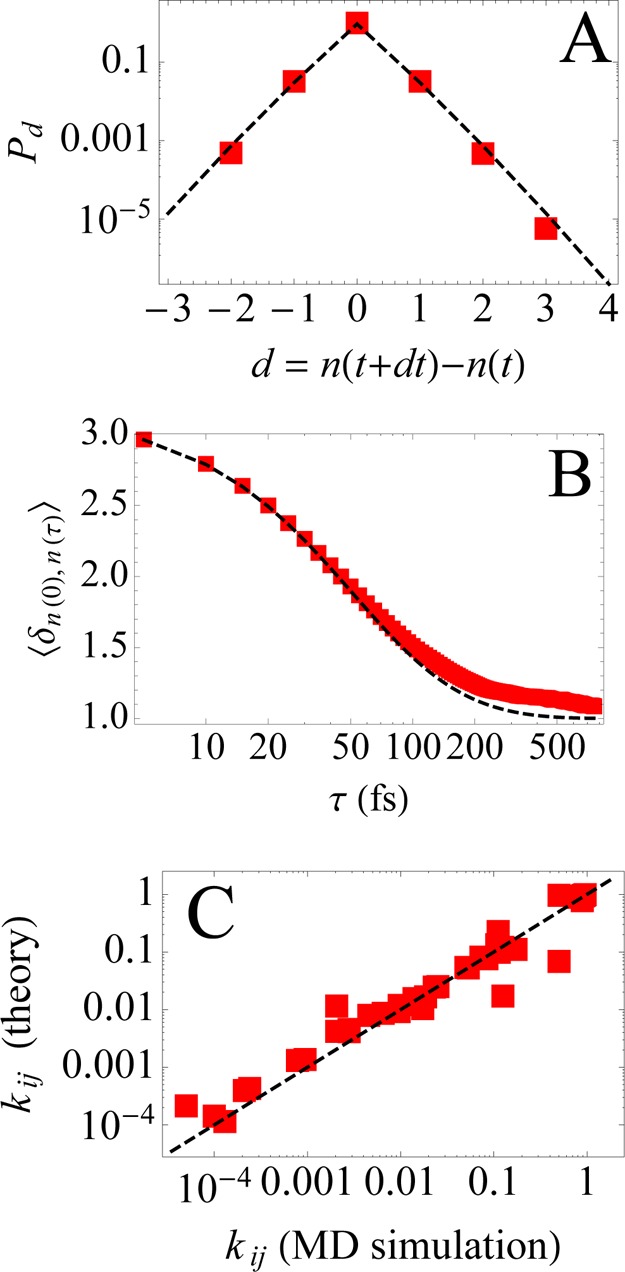
Figure 3.

Panel A: The probability Pd of jump size estimated from the trajectory derived from MD simulation (red squares) is compared to the one predicted using the transition probabilities of the Markov process (dashed black line). Panel B: The normalized occupancy autocorrelation ⟨δn(0),n(τ)⟩ as estimated from the MD trajectory and as predicted from the transition probabilities of the Markov process. Panel C: We directly compare the transition probabilities kij for the probability of transition i → j empirically obtained from the MD trajectory to the ones predicted by using eq 23.
