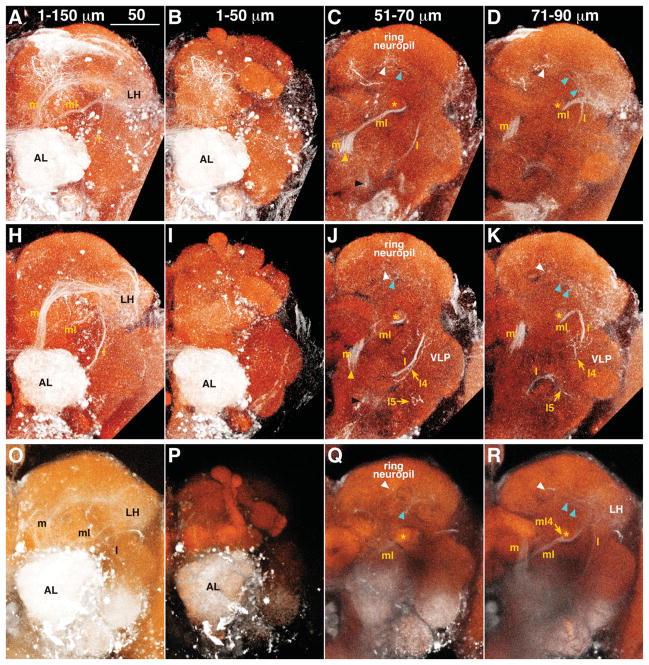
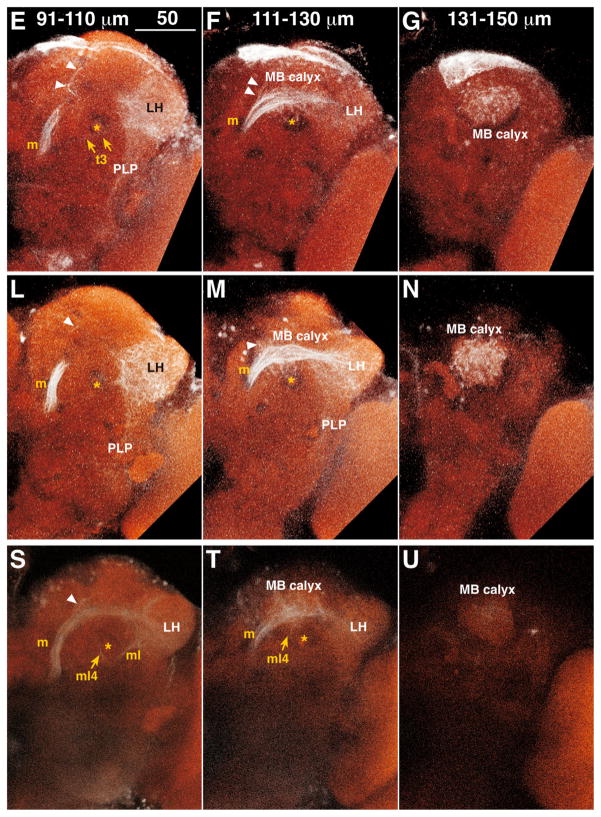
Figure 1.
A–U: Antennal lobe tracts (ALTs) in the left hemisphere. Results from three animals are shown, one per row. The depths of optical slices are shown in the top panel of each column. White: tetramethylrhodamine signal enhanced with Alexa Fluor 568; red: nc82 antibody staining. White and cyan arrowheads indicate fibers from the medial ALT and LH terminating in the ring neuropil, respectively. Yellow and black arrowheads show the positions of the dorsomedial and ventral root of ALTs, respectively. Asterisk indicates the pedunculus of MB. Dorsal is to the top, lateral to the right. AL, antennal lobe; l, lateral ALT; l4, lateral4 ALT; l5, lateral5 ALT; LH, lateral horn; m, medial ALT; MB, mushroom body; ml, mediolateral ALT; ml4, mediolateral4 ALT; PLP, posterior lateral protocerebrum; t3, transverse3 ALT; VLP, ventrolateral protocerebrum. Scale bars = 50 μm.


