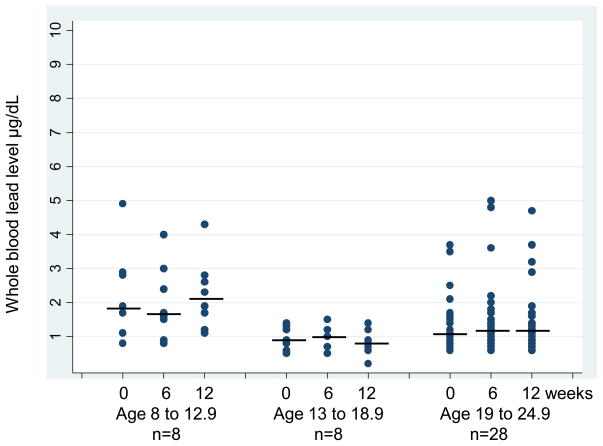
Figure 1.
Whole blood lead level is presented over time (0 = baseline, 6 = 6 weeks, 12 = 12 weeks) separately by age group: age 8 to 12.9, age 13 to 18.9 and age 19 to 24.9. The horizontal lines represent the median values in blood lead level. The Figure shows a higher whole blood lead throughout the study in the youngest age group compared to both older age groups (p ≤ 0.02).

