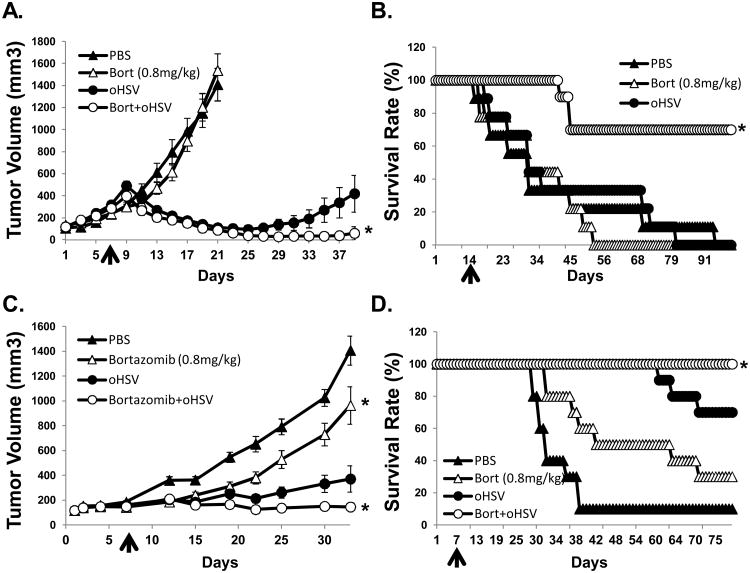
Figure 5. oHSV and bortezomib treatment enhances antitumor efficacy and survival in vivo.
A) Athymic nude mice were subcutaneously implanted with U251T3 glioma cells. When tumor size reached around 100 mm3, PBS or bortezomib (0.8 mg/kg) were administered via intra-peritoneal injection twice a week for the duration of the experiment. Seven days after initiation of drug treatment mice were injected intratumorally with 5 × 10⁴ pfu of 34.5ENVE or PBS. Data points represent the mean and 95% confidence intervals of the tumor size in each group at the indicated time points. (N=8/group) B) Athymic nude mice with intracranial GBM169 cells were treated with/without bortezomib (0.8 mg/kg administered intraperitoneally twice a week for the duration of the experiment) and were treated with intratumoral injection of HBSS or 1×10⁵ pfu of 34.5ENVE on day 14. Data shown are Kaplan Meier survival curves of animals in each group. (N=9/ group for mice treated with PBS or bortezomib alone, and n=10/group for mice treated with bortezomib and oHSV). C) Athymic nude mice were subcutaneously implanted with CAL27 head & neck cancer cells. When tumor size reached around 100 mm3, PBS or bortezomib (0.8 mg/kg) were administered via intra-peritoneal injection twice a week for the duration of the experiment. Following one week of bortezomib treatment, animals were injected intratumorally with HBSS or 1×10⁵ pfu of oHSV. Tumor volume was measured regularly after treatment. Data points represent the mean of the tumor size and 95% confidence intervals for each group at the indicated time points. (n=10/group) D) Kaplan Meier Survival curves of the data in (C). The percentage of surviving mice was determined by monitoring the death of mice over a period of 80 days after treatment.

