
Figure 2. Adenovirally-expressed GCaMP2.2(Low)-FKBP12.6 and untagged GCaMP2.2(Low) are positioned to measure local cleft [Ca2+]Cleft and, respectively, bulk cytosolic [Ca2+]Bulk, and are highly sensitive to Ca2+ in intact myocytes.
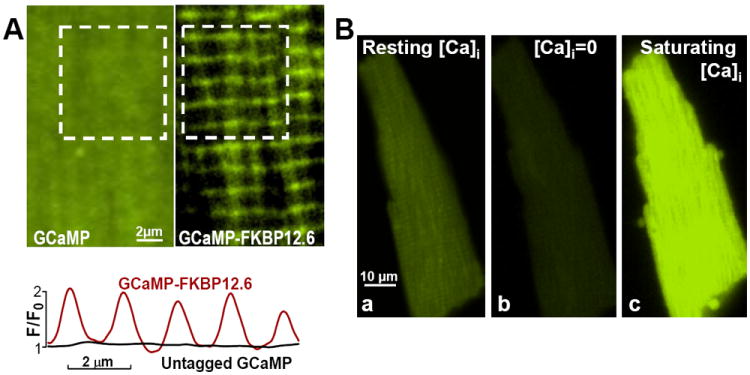
(A) Example of myocytes infected with adenoviruses expressing untagged GCaMP2.2Low (Left) and GCaMP2.2Low-FKBP12.6 (Right). Bottom panel shows the fluorescence profile along the longitudinal axis of the myocyte for the area shown in the white square in the top panels. Right and Left panels show limited areas from each myocyte; entire myocyte images are in Online Fig. V. (B) Ca2+-sensitivity of GCaMP2.2Low-FKBP12.6 in intact cells. A resting myocyte expressing GCaMP2.2Low-FKBP12.6 was imaged first under control conditions (Ba). The cell was then exposed to Ca2+-free external solution in the presence of 10 μmol/L ionomycin (Bb). This resulted in a significant fluorescence drop (Fmin). Then, the cell was Ca2+-overloaded in a 0Na+/1 mmol/L Ca2+ external solution, which favors Ca2+ entry via both ionomycin and reverse mode Na+/Ca2+ exchange, to saturate the sensor and determine Fmax (Bc). The Fmax/Fmin ratio for this cell is 6.2.