
Figure 2.
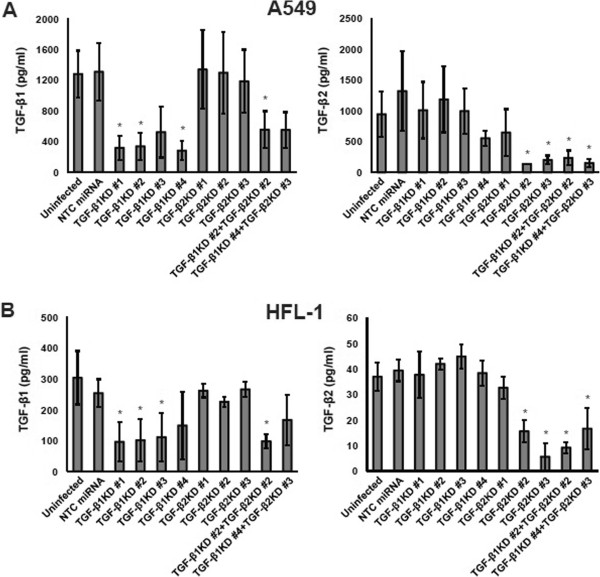
Knockdown of TGF-β ligands. A: TGF-β1 and TGF-β2 concentrations measured by ELISA in the supernatant of A549 cells transduced with each miRNA. Left: TGF-β1. Right: TGF-β2. Data shown are the means ± SEM of triplicate analyses. KD: knockdown. NTC: negative control. The concentration of TGF-β1 or TGF-β2 in the supernatant of cells with TGF-β1 and/or TGF-β2 knockdown was compared to that of cells transduced with NTC miRNA. Statistical significance was determined by Dunnett’s test. * P < 0.05. B: TGF-β1 and TGF-β2 concentrations measured by ELISA in the supernatant of HFL-1 cells.