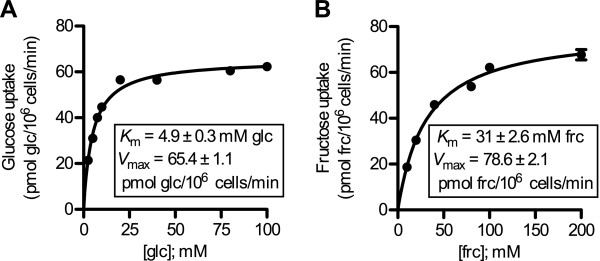
Figure 4.

Glucose and fructose uptake kinetics of ApST4. Yeast cells expressing ApST4 were incubated in various concentrations of 14C-glucose and 14C-fructose (as indicated). (A) Glucose and (B) fructose uptake kinetics were fitted to Michaelis-Menten equations and K m and V max was determined by nonlinear regression using Prism 5.0c software. All uptake experiments were performed at 30°C and cells were collected by rapid-filtration after 10 min. Sugar uptake was determined by liquid scintillation counting. Transport was corrected for background uptake into control (−) cells transformed with an empty expression vector. Each value is the mean ± SEM, n = 3.
