
Figure 1.
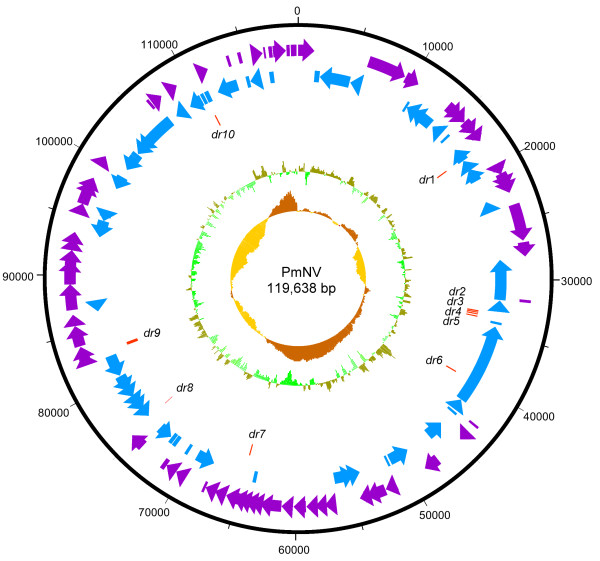
Circular map of the PmNV genome. Purple represents the 60 forward strand ORFs and blue represents the 55 reverse strand ORFs. Red represents the 10 direct repeat (dr) regions, which are dispersed around the genome. The innermost circle shows GC skew, which indicates possible locations of the DNA leading strand, lagging strand, replication origin, and replication terminal during DNA replication. Below average GC skew is light orange and above average dark orange. The next innermost circle is a GC plot, with light green representing below average GC content, and dark green indicating above average GC content.