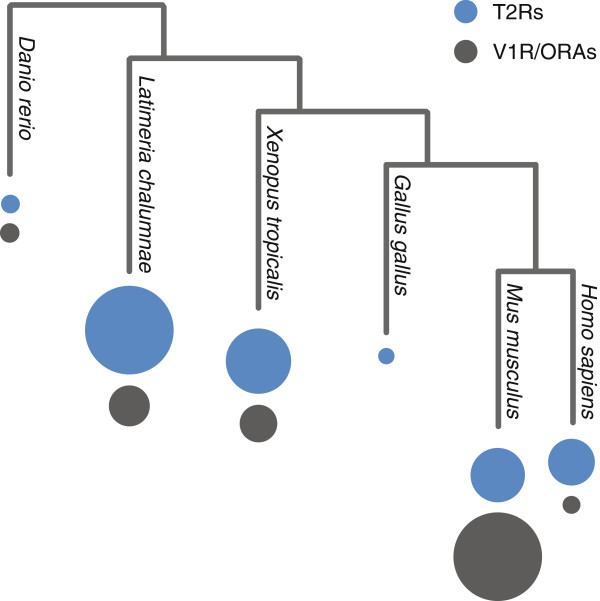
Figure 8.

Evolutionary dynamic of vertebrate t2r and v1r gene repertoires. Species tree with the respective T2R (blue circle) and V1R/ORA (black circle) repertoires. Circle area is proportional to the size of the gene family. Values for Latimeria T2R and V1R families, this study; t2r gene family size for other species was taken from [11], teleost ORA and frog V1R family size from [10] and mouse V1R family size from [25].
