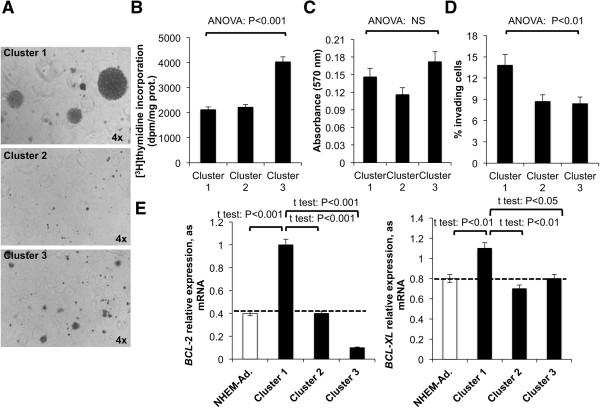
Figure 8.

Growth, invasiveness, and survival potential of melanoma clusters. (A) Images of colonies formed by representative melanoma cells grouped in cluster 1 (L6), 2 (L1), and 3 (L4) in the soft-agar assay after 3 weeks of incubation at 37°C. Original magnification x4 (Olympus Ix50). Three replicate experiments were performed. Similar results were obtained for other melanoma cell lines according to the clustering. (B) Average value of proliferation of melanoma cells grouped in cluster 1, 2, and 3 assessed using [3H] thymidine incorporation and (C) MTT assay. NS: non significant. Four replicate experiments were performed. (D) Average invasiveness potential assessed by Matrigel invasion assay of melanoma cells grouped in cluster 1, 2, and 3. Three replicate experiments were performed. (E) Average mRNA expression of BCL-2 and BCL-XL in melanoma cell lines classified in clusters 1, 2, and 3 and in adult melanocytes. Dotted line represents BCL-2 and BCL-XL expression level in adult melanocytes. Values are the mean ± S.D. of four independent experiments.
