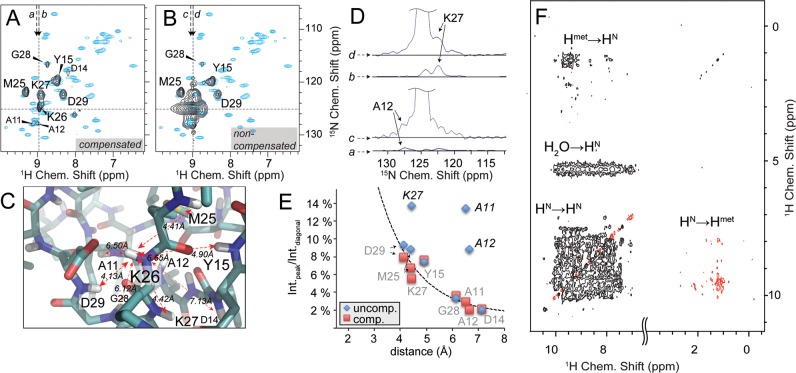
Figure 2.
4D spectroscopy and diagonal compensation. (A) A representative F3(15N)/F4(1H) 2D slice as an excerpt of a NUS diagonal-free 4D experiment (black contours), with indirect F1(1H)/F2(15N) chemical shifts set as indicated by dashed lines, showing spatial contacts of K26 HN. *L61 is a bleed-through and has maximum intensity at different F1/F2 shifts. (B) The nondiagonal-free spectrum at identical shifts. In both slices the reference 2D HN correlation (cyan contours) is overlaid for better overview. (C) Neighboring amides of K26 as a representative residue as seen in the crystal structure of the SH3 domain of α-spectrin (PDB: 2NUZ) and their distances to K26 HN. D) Traces along F3 through K26/K27 and K26/A12 cross peaks (as shown by arrows in A and B), which are in relative proximity to the diagonal. Whereas K27 peak intensity (traces b vs d) is doubled in comparison to its expected value, intensities of distant A12 (traces c vs a) are fully dominated by the diagonal. The same is true also for A11 (as can be seen in E). (E) 4D peak volumes extracted from the respective 2D slice and plotted over their corresponding internuclear distances (extracted from X-ray structure 2NUZ). Peaks significantly deviating from a consistent distance/intensity relation (delineated by the dashed line) incur erroneous distance restraints. The error introduced by noise is on the order of the symbol sizes used. (F) The set of resonances recorded in regular homonuclear correlation experiments consist of amide/amide cross peaks, whereas only one peak per amino acid pair is observed. Thus, every cross peak contains useful and nonredundant information. For time-shared versions and adequate protein labeling, additional correlations are recorded involving methyls. This 2D plane was recorded using the shortened version of the pulse scheme shown in Figure 1. Negative contours are shown in red. See Supporting Information, Figure 2 for the same spectrum without diagonal compensation.

