Figure 4.
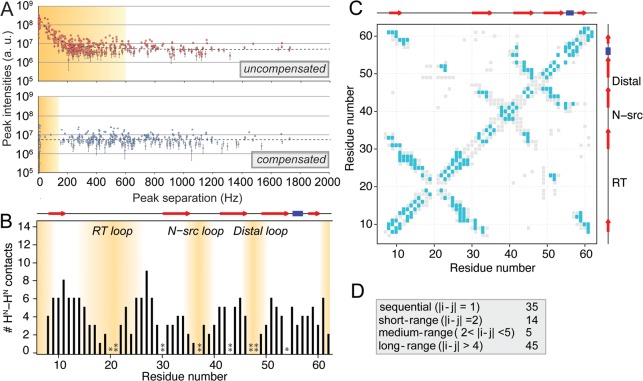
Correlations obtained in homonuclear 1H–1H experiments on perdeuterated SH3. (A) All peak-like intensity above the noise level, picked at root resonance combinations (H/N HSQC shift pairs) only and representing potential (but not necessarily real) cross peaks. Orange shading represents the minimum space affected by diagonal signal, within which a great part of all peak-like intensity actually represents artifact peaks. Note the logarithmic scale of the Y-axis. Error bars refer to the noise level in the spectrum. Peak intensities were normalized using the F52/K26 cross peak as a representative peak, well separated from the diagonal. (B) Numbers of amide–amide contacts observed for a 4D version recorded on the SH3 domain of α-spectrin (black bars). Less peak intensity and fewer contacts are seen in the flexible loop regions (orange shades). Most contacts are long-range contacts and thus of high benefit for structure calculation. One asterisk indicates Pro residues, two asterisks denote those residues which are exchange-broadened in HN correlations and/or have not be assigned unambiguously. (C) Contact map of all visible correlations (cyan rectangles) overlaid on all residue pairs within 7.5 Å (gray rectangles). (D) Classification of the extracted (nonredundant) distance restraints.

