
Figure 3.
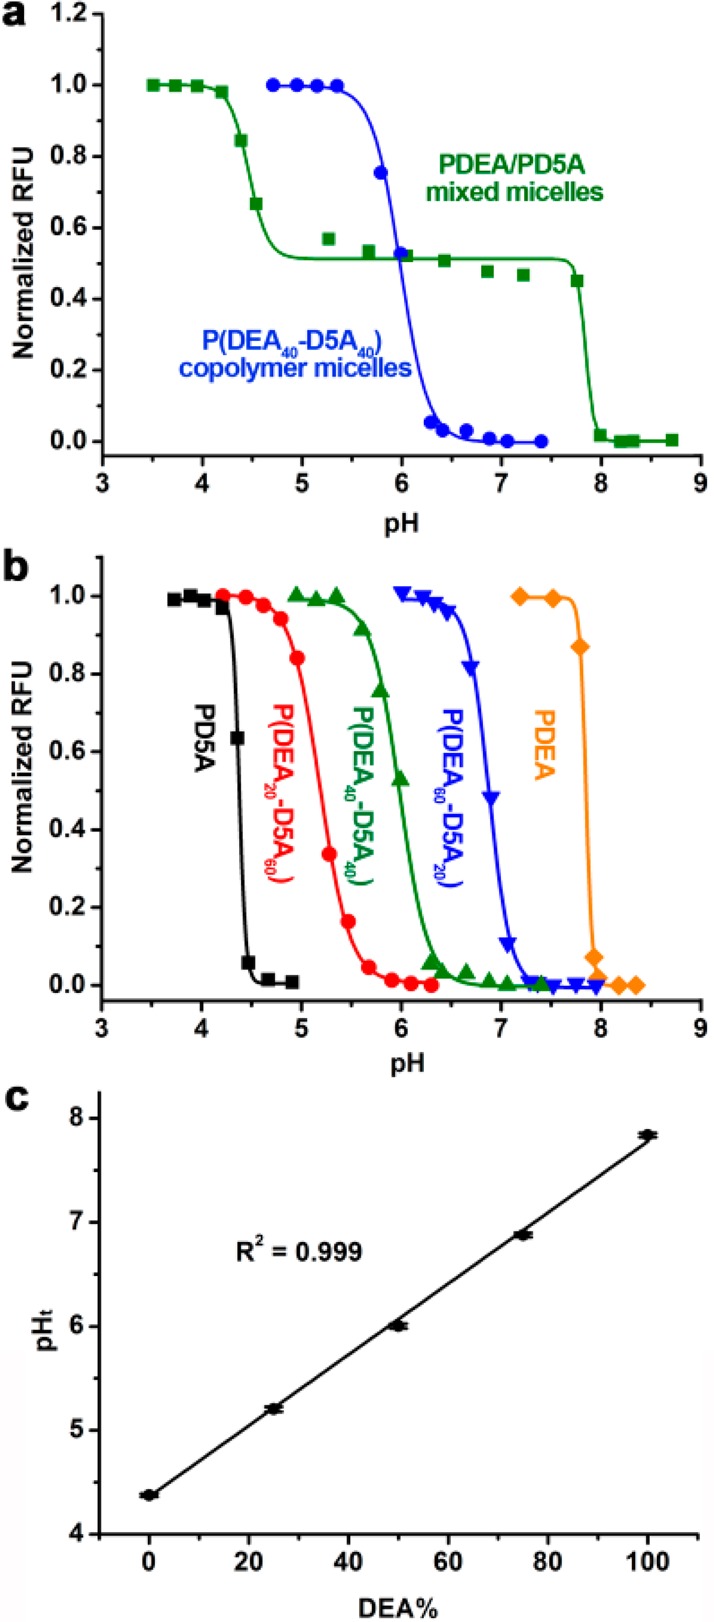
(a) Comparison of PDEA/PD5A molecular mixture vs P(DEA40-D5A40) copolymer strategies for control of pHt. (b) Normalized fluorescence intensity of P(DEAx-D5Ay) nanoprobes with different ratios of the two monomers as a function of pH. (c) Nanoprobe pHt is linearly correlated with the molar fraction of the DEA-MA monomer in the PR segment. Error bars were calculated from three repeating experiments (n = 3). Polymer concentrations were 0.1 mg/mL in these studies.