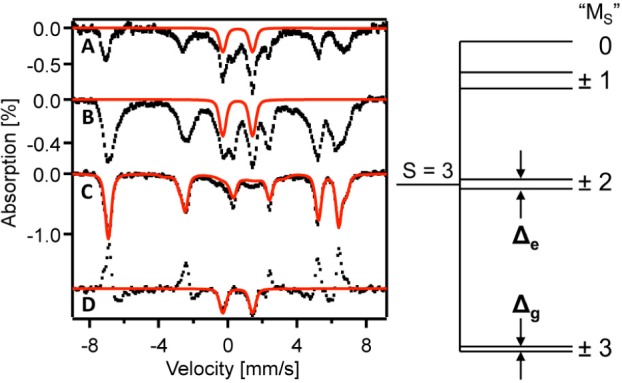
Figure 4.

Left: 4.2 K Mössbauer spectra of 2 recorded in zero field (A) parallel applied fields of 2.2 mT (B) and 45 mT (C). (D) Difference spectrum “2.2 mT minus 45 mT”. Red lines in A, B, and D outline a quadrupole doublet that represents ≈10% of the Fe attributed to 2. Red line in C is a spectral simulation for 2 based on eq 1 and represents 89% of the Fe. Red line represents two similar S = 3 species, 2a and 2b (parameters of 2b are given in italics): % Fe 62(27), D = −1.2(−1.2) cm–1, E/D = 0.08(0.08), δ = 0.58(0.58), ΔEQ = −1.65(−1.65) mm/s, η ≈ 0.0(0.6), Az/gnβn = −13.8(−14.4) T (because ⟨Sx,y⟩ ≈ 0, the spectra are insensitive Ax and Ay). Right: Splittings of the S = 3 multiplet; for labels, see ref (18).
