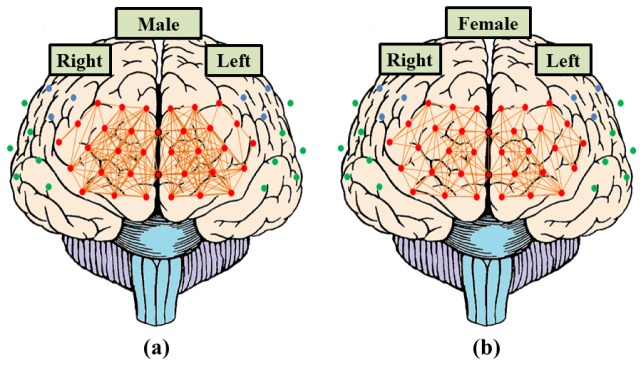
Fig. 6.

The functional connectivity pattern of left-side and right-side PFC in resting-state of (a) male group and (b) female group. The red dots represent the channels of each PFC region. The orange lines represent the functional connectivity (group-level correlation network) of left-side and right-side PFC region with correlation coefficient rXY larger than 0.6.
