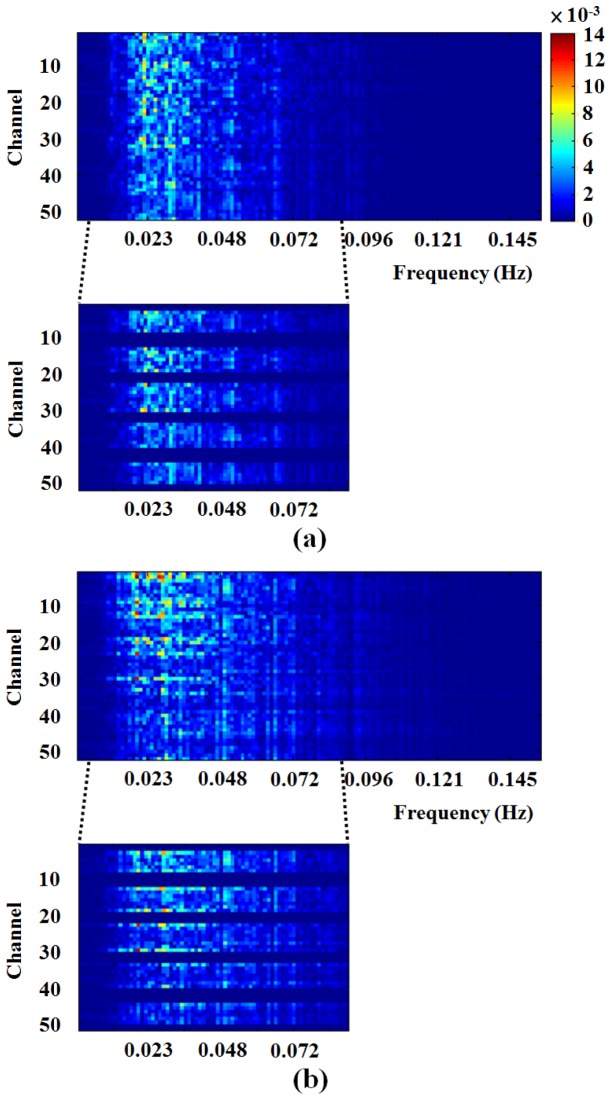
Fig. 8.
The spectrogram of ΔtHb of each channel from (a) male and (b) female groups. Color bar indicates the intensity of frequency. The range of frequency 0.01 to 0.08 Hz was used to assess the significantly different channel of PFC between male and female groups. The channels of PFC regions are Ch. 3 to 8; Ch. 13 to 19; Ch. 23 to 30; Ch. 34 to 40 and Ch. 45 to 50 of frequency 0.01 to 0.08 Hz were highlighted on the bottom of figure.

