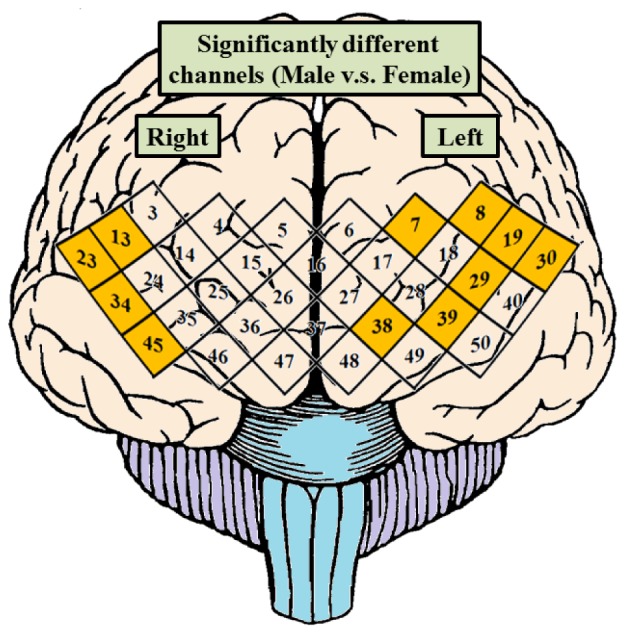
Fig. 9.

The result of two-sample t-test from power spectrum of each channel of PFC between male and female groups. The Ch. 7, 8, 19, 29, 30, 38, and 39 marked with orange diamonds of left-side PFC and Ch. 13, 23, 34, and 45 marked with orange diamonds of right-side PFC are significantly different with p value < 0.001 between male and female groups.
