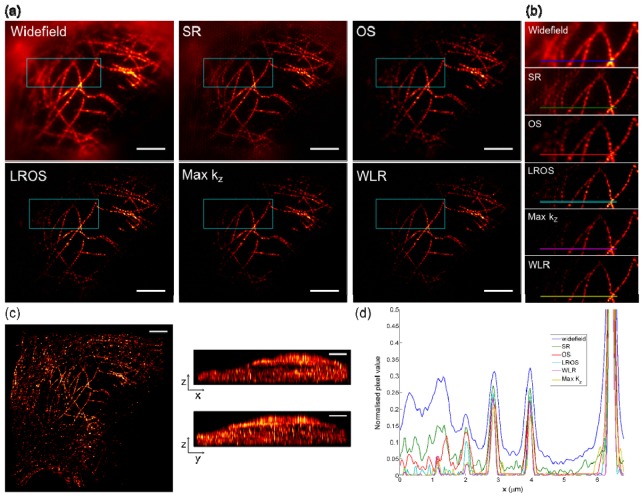
Fig. 5.
(a) Images of microtubules in a HeLa cell. Staining for tubulin with rat anti-tubulin primary and anti-rat-Alexa 488 secondary antibodies. (b) Magnified images of boxed regions in main images. FWHM of the axial response for a small region close to the center of the image was 0.82 μm, 0.71 μm, 0.67 μm and 0.66 μm for OS, LROS, Max kz and WLR methods respectively. (c) Projections of a 3D rendering of the z-stack of images formed using the WLR reconstruction. Scale bars are 4 μm. (d) Line profiles along the coloured lines shown in (b).

