
Fig. 4.
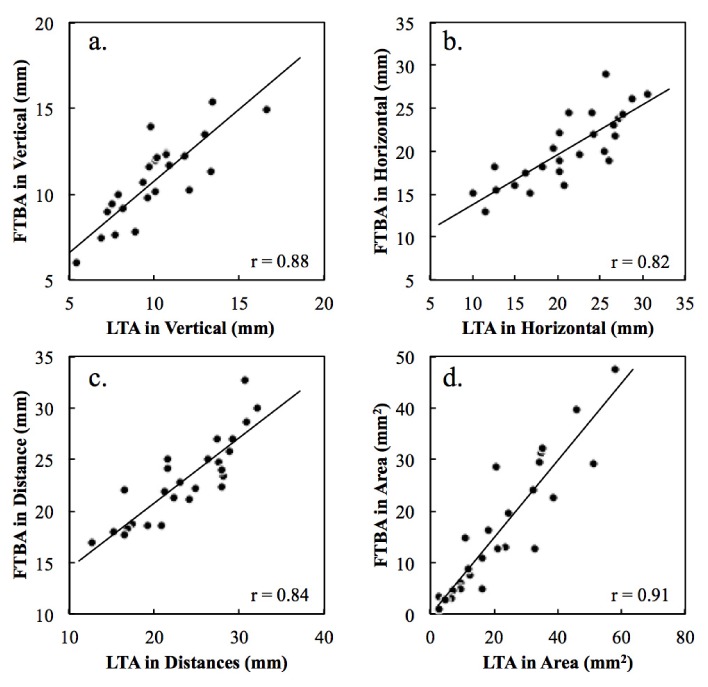
The scatter plots of the FTBA (fluorescein tear film break-up area) and LTA (lower temperature area), in the vertical-center-distance (a.), in horizontal-center-distance (b.), total-center-distances (c.), and the area (d.).
Official websites use .gov
A
.gov website belongs to an official
government organization in the United States.
Secure .gov websites use HTTPS
A lock (
) or https:// means you've safely
connected to the .gov website. Share sensitive
information only on official, secure websites.
The scatter plots of the FTBA (fluorescein tear film break-up area) and LTA (lower temperature area), in the vertical-center-distance (a.), in horizontal-center-distance (b.), total-center-distances (c.), and the area (d.).