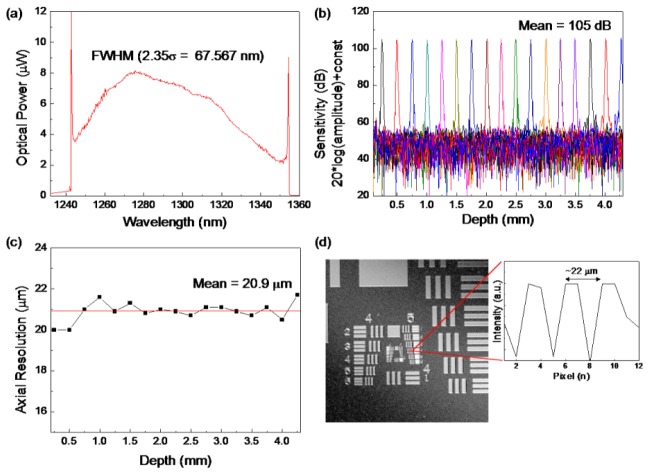
Fig. 3.
(a) Optical spectrum of the probe output of the VCSEL SS-OCT system. (b) Logarithmic plot of the measured sensitivity profiles (divided the PSF by the standard deviation of noise floor) against the different imaging depth. Sensitivity reduction is negligible up to depth of 4.25 mm in air. (c) Free space axial resolution values defined as FWHM of the PSF amplitudes with the imaging depth. Horizontal line indicates the mean value of 20.9 µm. (d) En face OCT image of top surface of the 1951 USAF test target. From an intensity line profile (solid line in the image), a fair of lines with a distance gap of 22 µm are recognizable, corresponding to the lateral resolution of the system.

