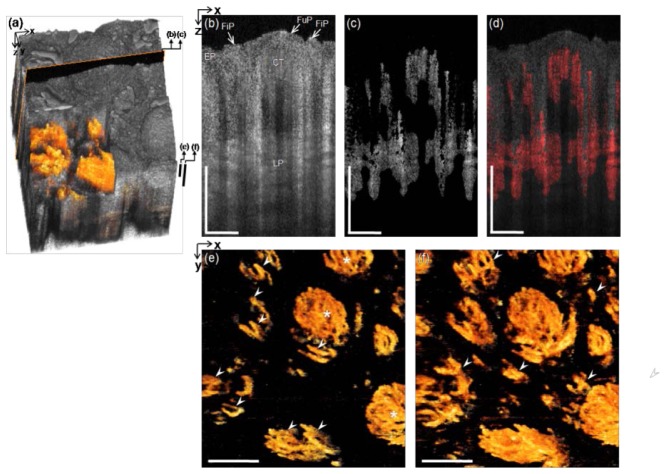
Fig. 5.
In vivo microvascular imaging at the tongue apex of a healthy volunteer with the forward-viewing probe. (a) 3D rendered OCT structural image with the 3D mOMAG data (yellow) overlay. (b) and (c) Representative cross-sectional structural and mOMAG images (2.0 mm (X) × 1.66 mm (Z)) at a position (a black box) in (a), respectively. (d) Overlay of the mOMAG image (red) on the structural image. EP: epithelium, FuP: fungiform papillae, FiP: filiform papillae, CT: connective tissue, LP: lamina propria. (e) and (f) 2D en face views (2.0 mm (X) × 2.0 mm (Y)) of the 3D mOMAG data volumes taken over depths of 434 µm and 692 µm from the surface, respectively. Black bars in (a) are the depth ranges for (e) and (f). Arrow heads in (e) and (f) indicate vertically oriented separate capillary loops in the individual FiPs, which are much narrower and fewer than those of the FuPs (asterisks in (e)). A fly-through image of the microvasculature is shown with a movie clip (Media 2 (6.6MB, MPG) ). Scale bars: 0.5 mm.

