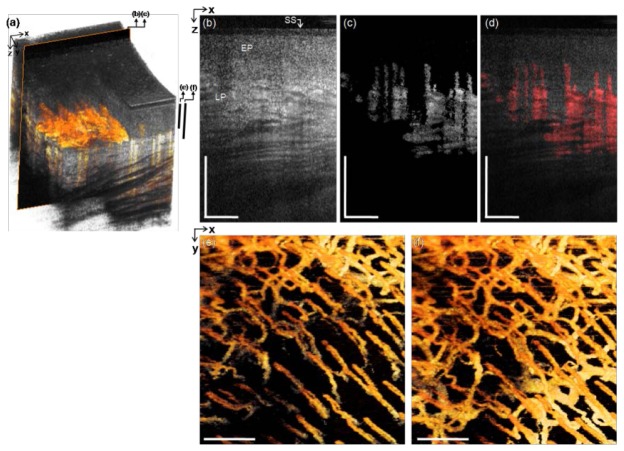
Fig. 7.
In vivo microvascular imaging of buccal (chick) mucosa of a healthy volunteer with the side-viewing probe. (a) 3D rendered OCT structural image with the 3D mOMAG data (yellow) overlay. (b) and (c) Representative cross-sectional structural and mOMAG images (2.0 mm (X) × 1.72 mm (Z)) at a position (a black box) in (a), respectively. (d) Overlay of the mOMAG image (red) on the structural image. SS: sheath surface, EP: epithelium, LP: lamina propria. (e) and (f) 2D en face views (2.0 mm (X) × 2.0 mm (Y)) of the 3D mOMAG data volumes taken over depths of 461 µm and 588 µm from the surface, respectively. Black bars in (a) are the depth ranges for (e) and (f). The vascularity is quite similar to the mucolabial microcirculatory bed in Fig. 6. A fly-through image of the microvasculature is shown with a movie clip (Media 4 (5.9MB, MPG) ). Scale bars: 0.5 mm.

