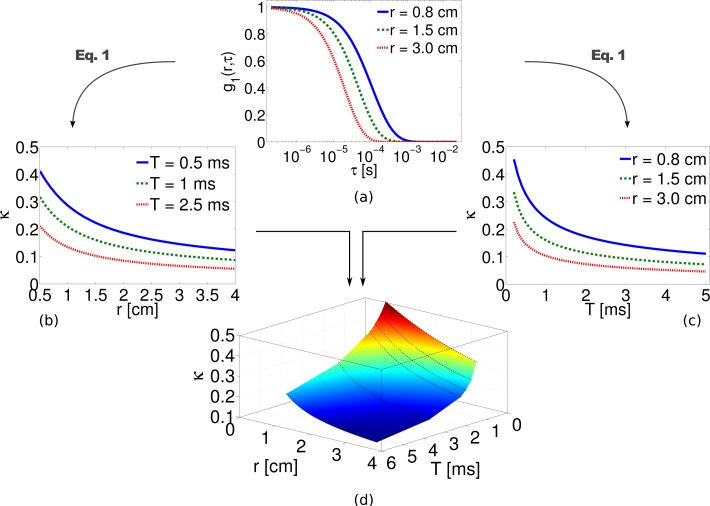
Fig. 1.
Normalized field auto-correlation function for three different source-detector separations is calculated using Eq. (3) in panel (a). The dependence of the speckle contrast derived from Eq. (1) on (b) source-detector separation and (c) exposure time for a point source are also shown. The combined result can be viewed (d) as a surface plot of the speckle contrast dependence on both distance and exposure time. Here = 10 cm−1, μa = 0. 1 cm−1, DB = 1 × 10⁻⁸ cm2/s.

