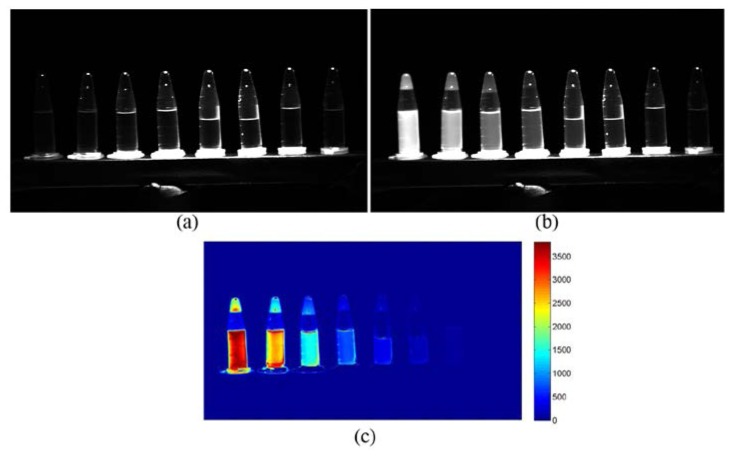
Fig. 5.
(a) NIR image of ICG samples under normal surgical lighting condition; (b) NIR image of ICG samples under the surgical lighting condition with excitation light on; (c) Difference image between (a) and (b). The concentration of ICG from left to right are 10.32 μM, 5.16 μM, 2.58 μM, 1.29 μM, 0.65 μM, 0.32 μM, 0.13 μM and 0 μM respectively.

