
Fig. 6.
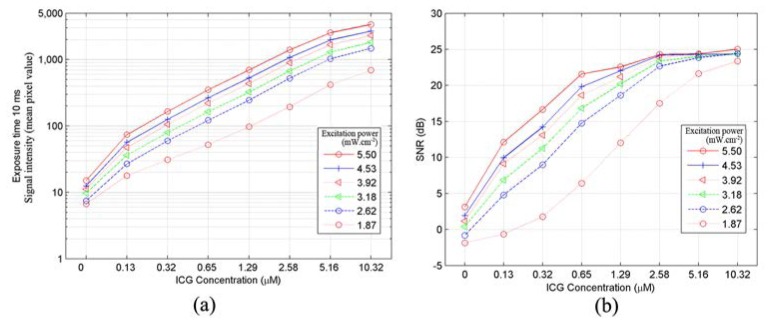
(a) ICG sensitivity curve plot, showing the fluorescence signal intensity versus ICG concentration and NIR excitation power, and (b) SNR versus ICG concentration and NIR excitation power.
Official websites use .gov
A
.gov website belongs to an official
government organization in the United States.
Secure .gov websites use HTTPS
A lock (
) or https:// means you've safely
connected to the .gov website. Share sensitive
information only on official, secure websites.
(a) ICG sensitivity curve plot, showing the fluorescence signal intensity versus ICG concentration and NIR excitation power, and (b) SNR versus ICG concentration and NIR excitation power.